A showcase of some of the work I produced while working with AgResearch as part of a 10-week summer internship. My main focus was on building an online toolkit that would become a part of the larger T-Platform Project.
My role included the following:
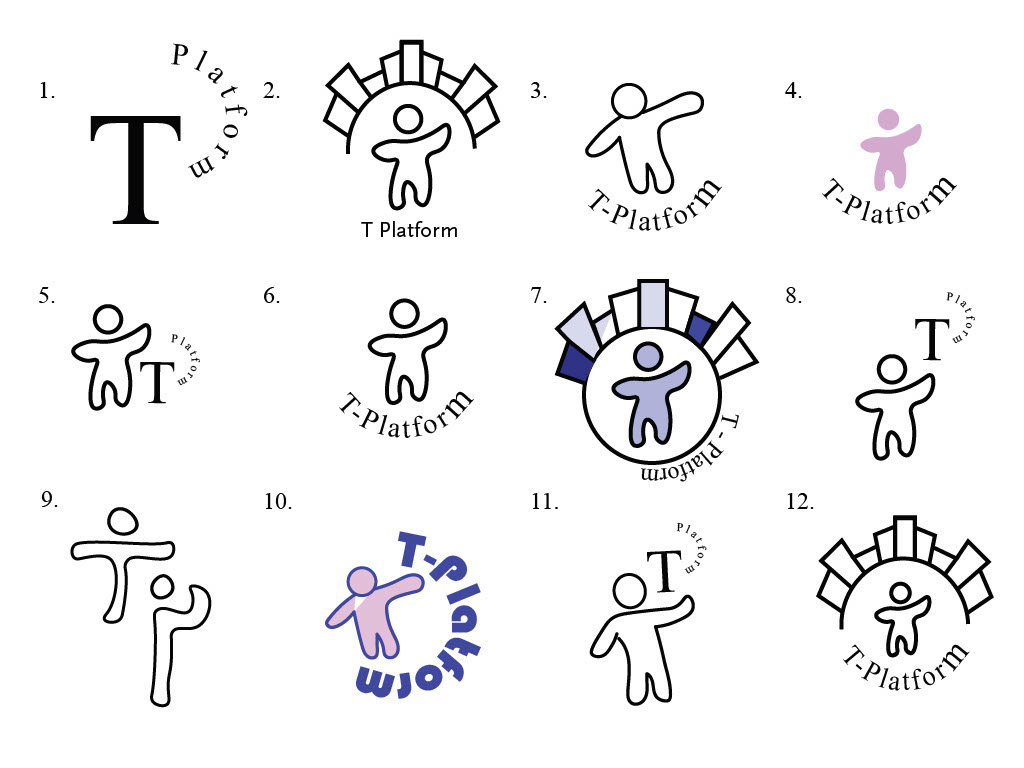
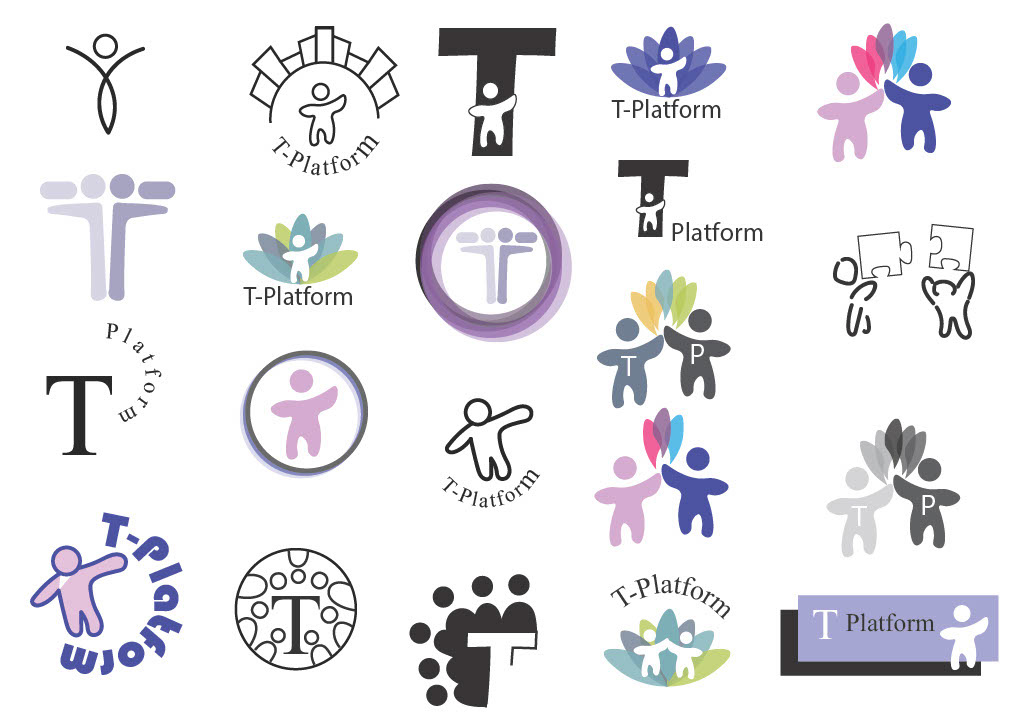
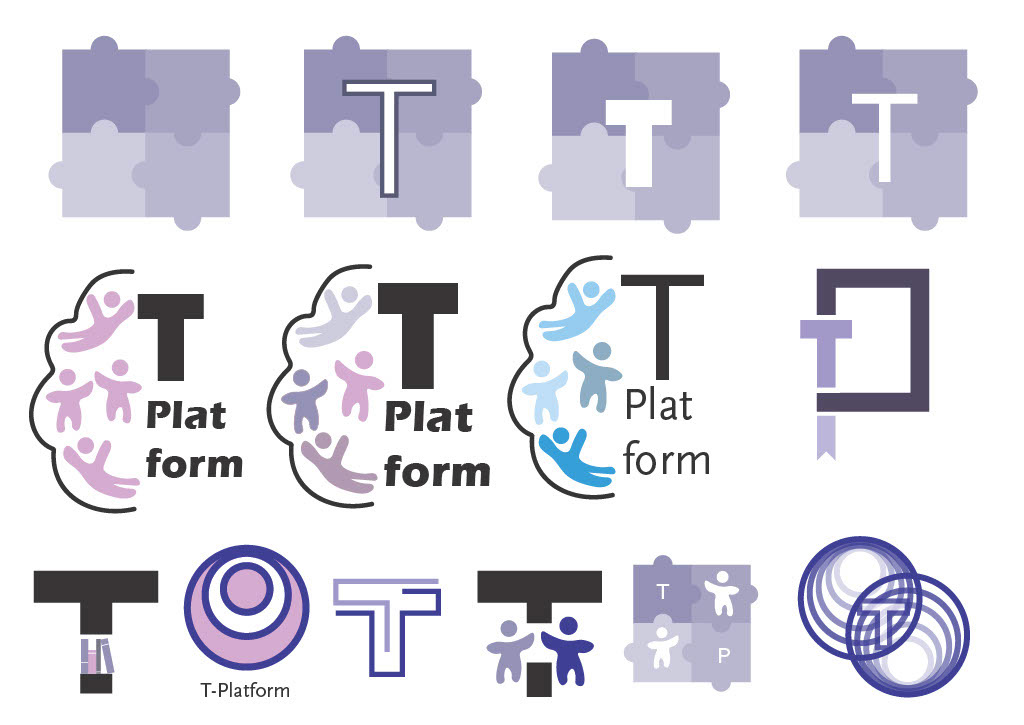
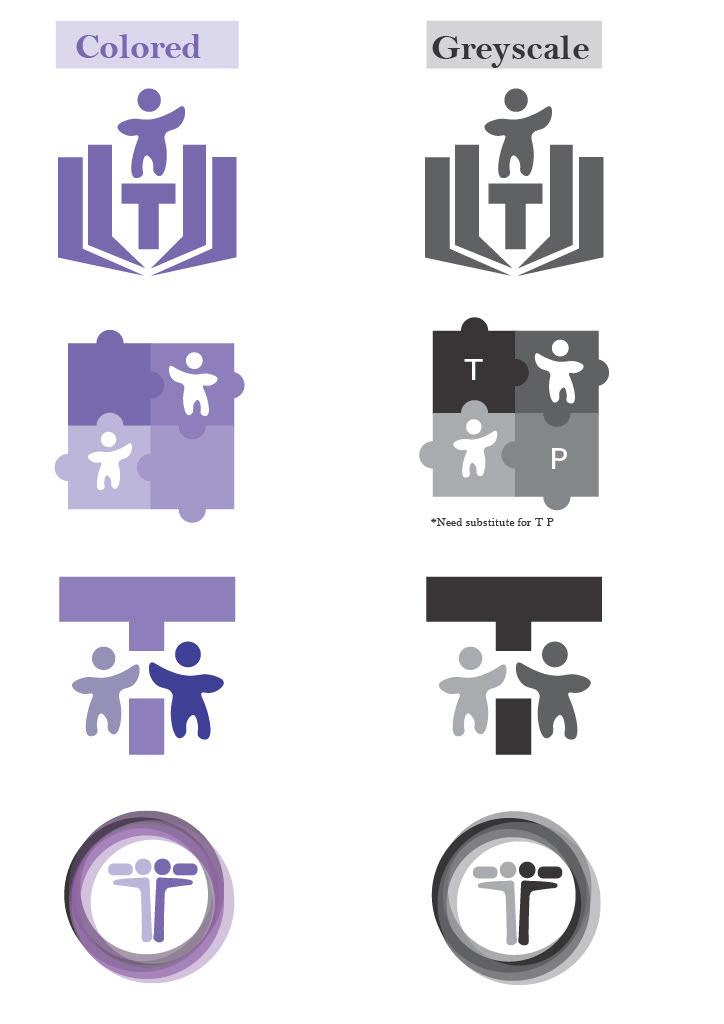
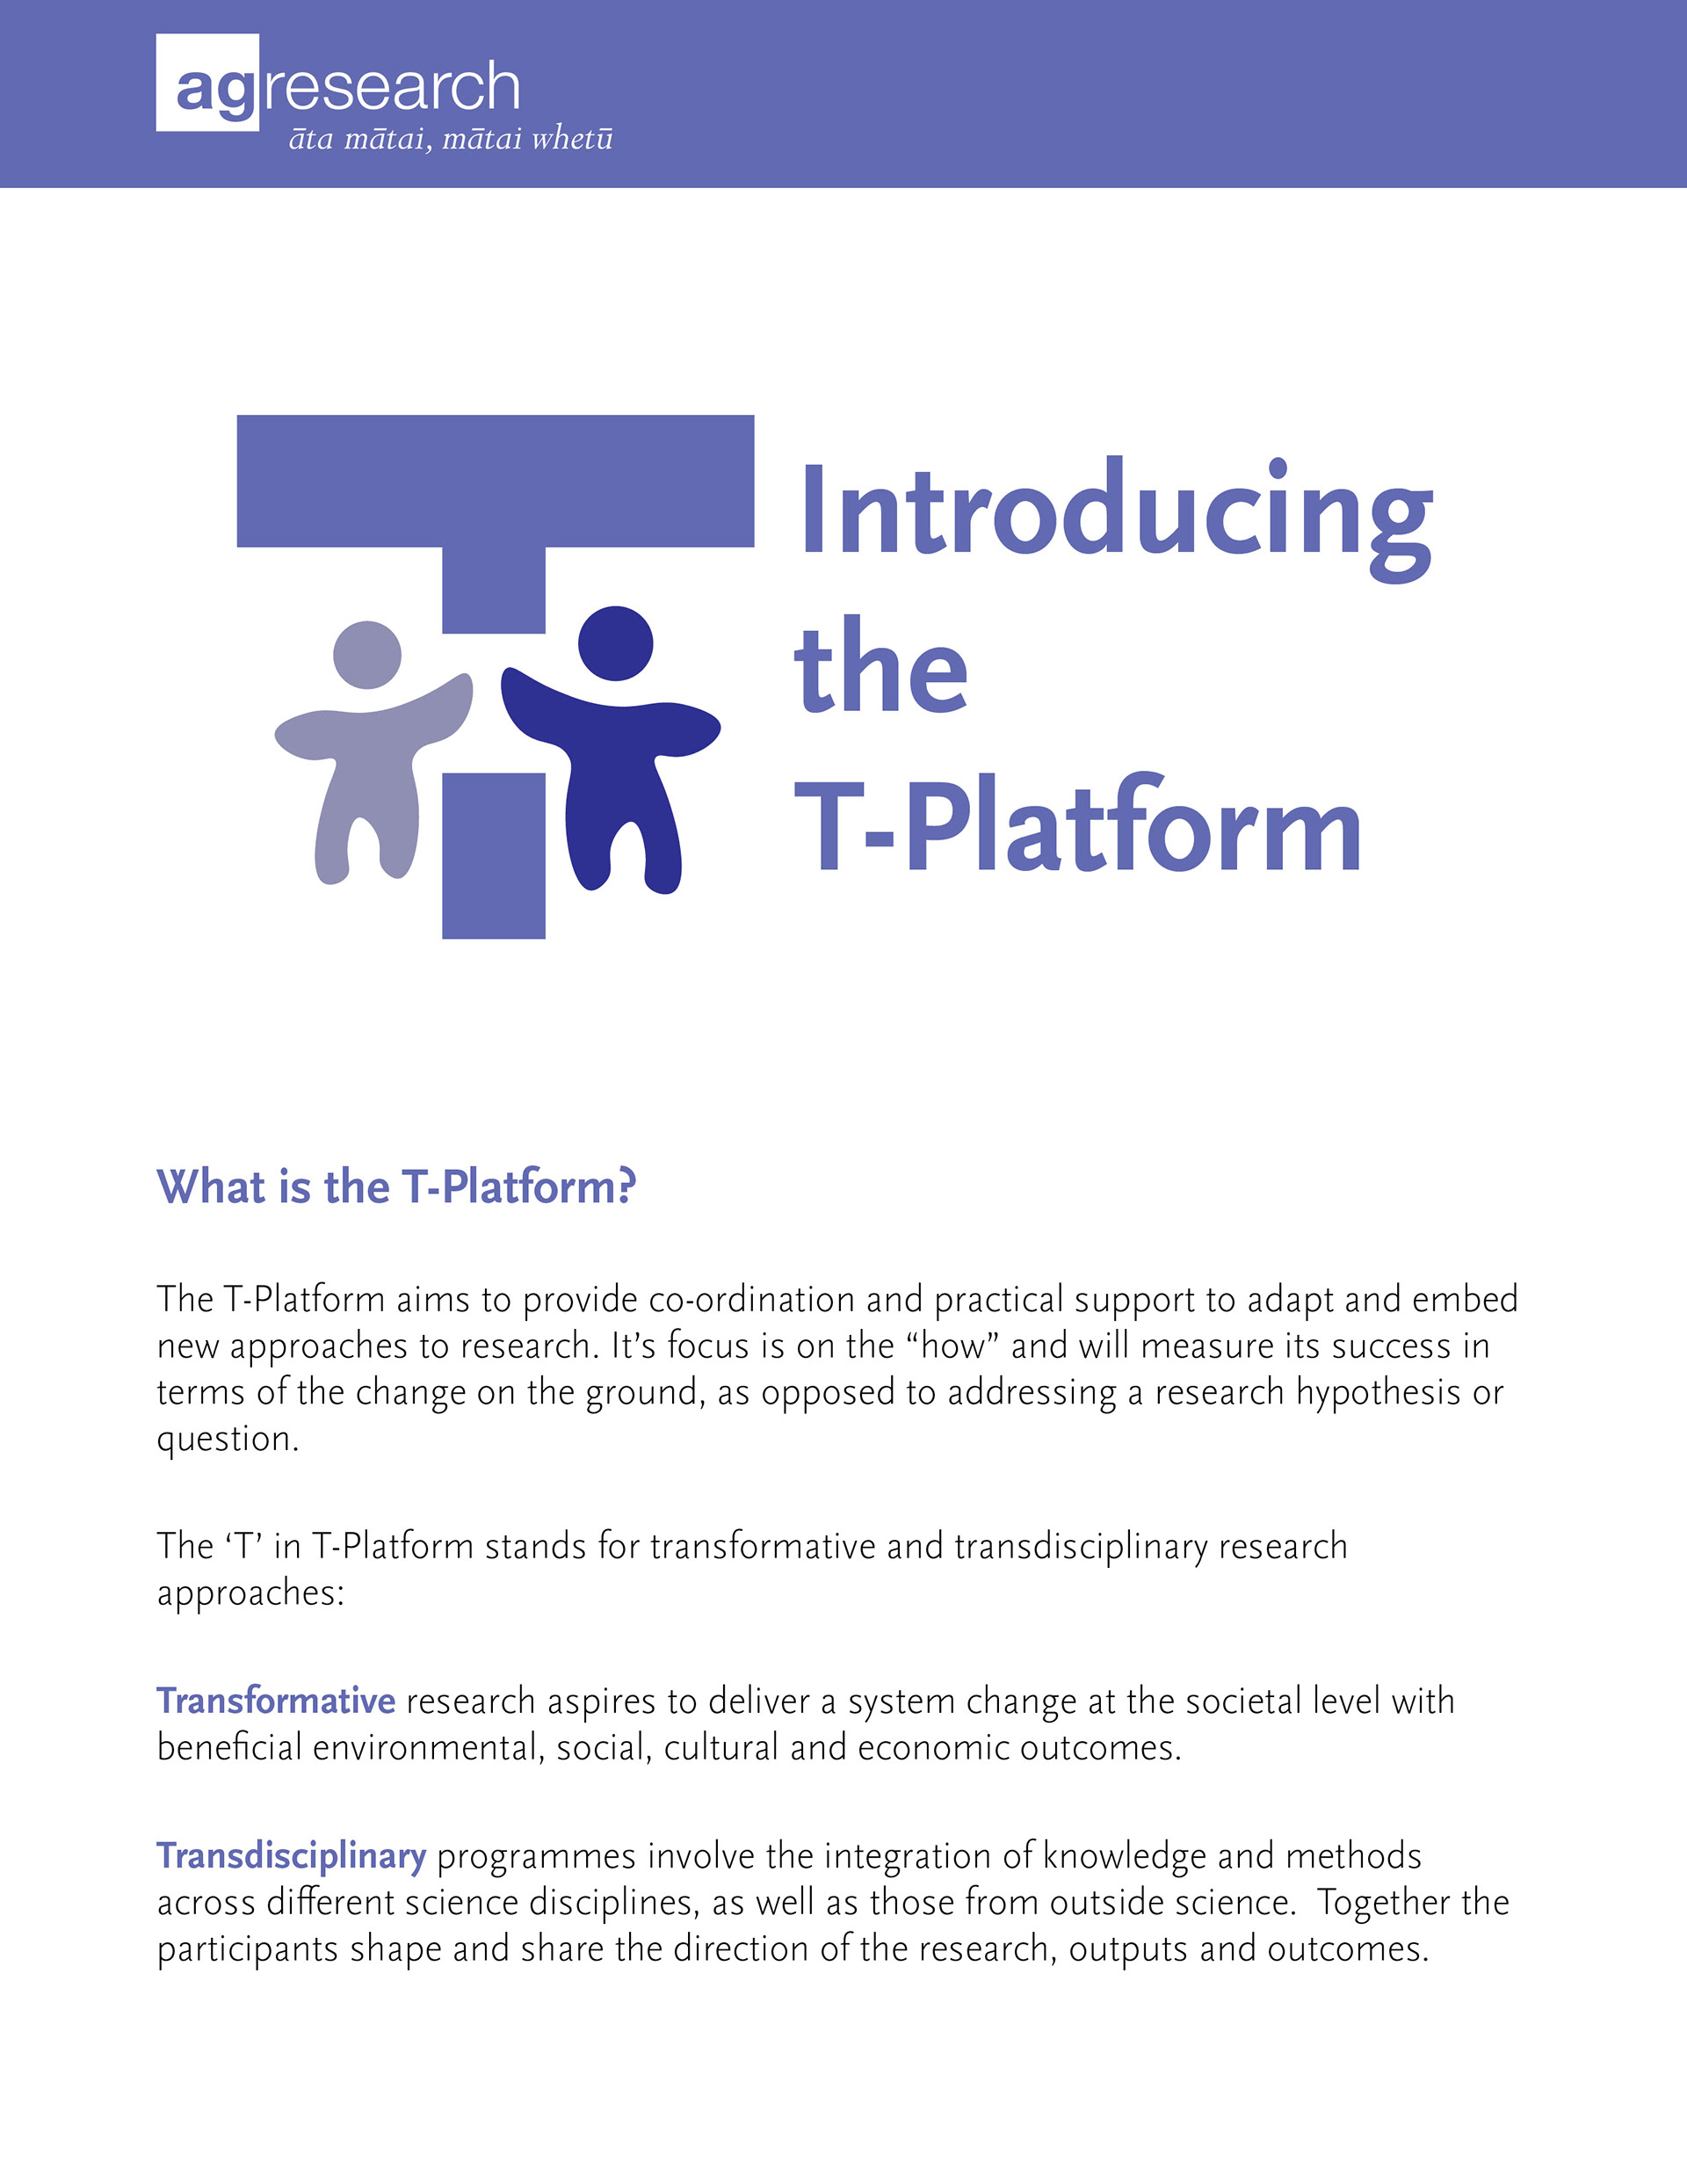
Designing a logo package for the overall T-Platform project that was both simple while still conveying a message about the purpose of the project.
Meeting with people throughout the company such as Scientists, and Project Leaders to discuss tools they felt would better support their projects. This would include both reformatting older tools, and creating new tools.
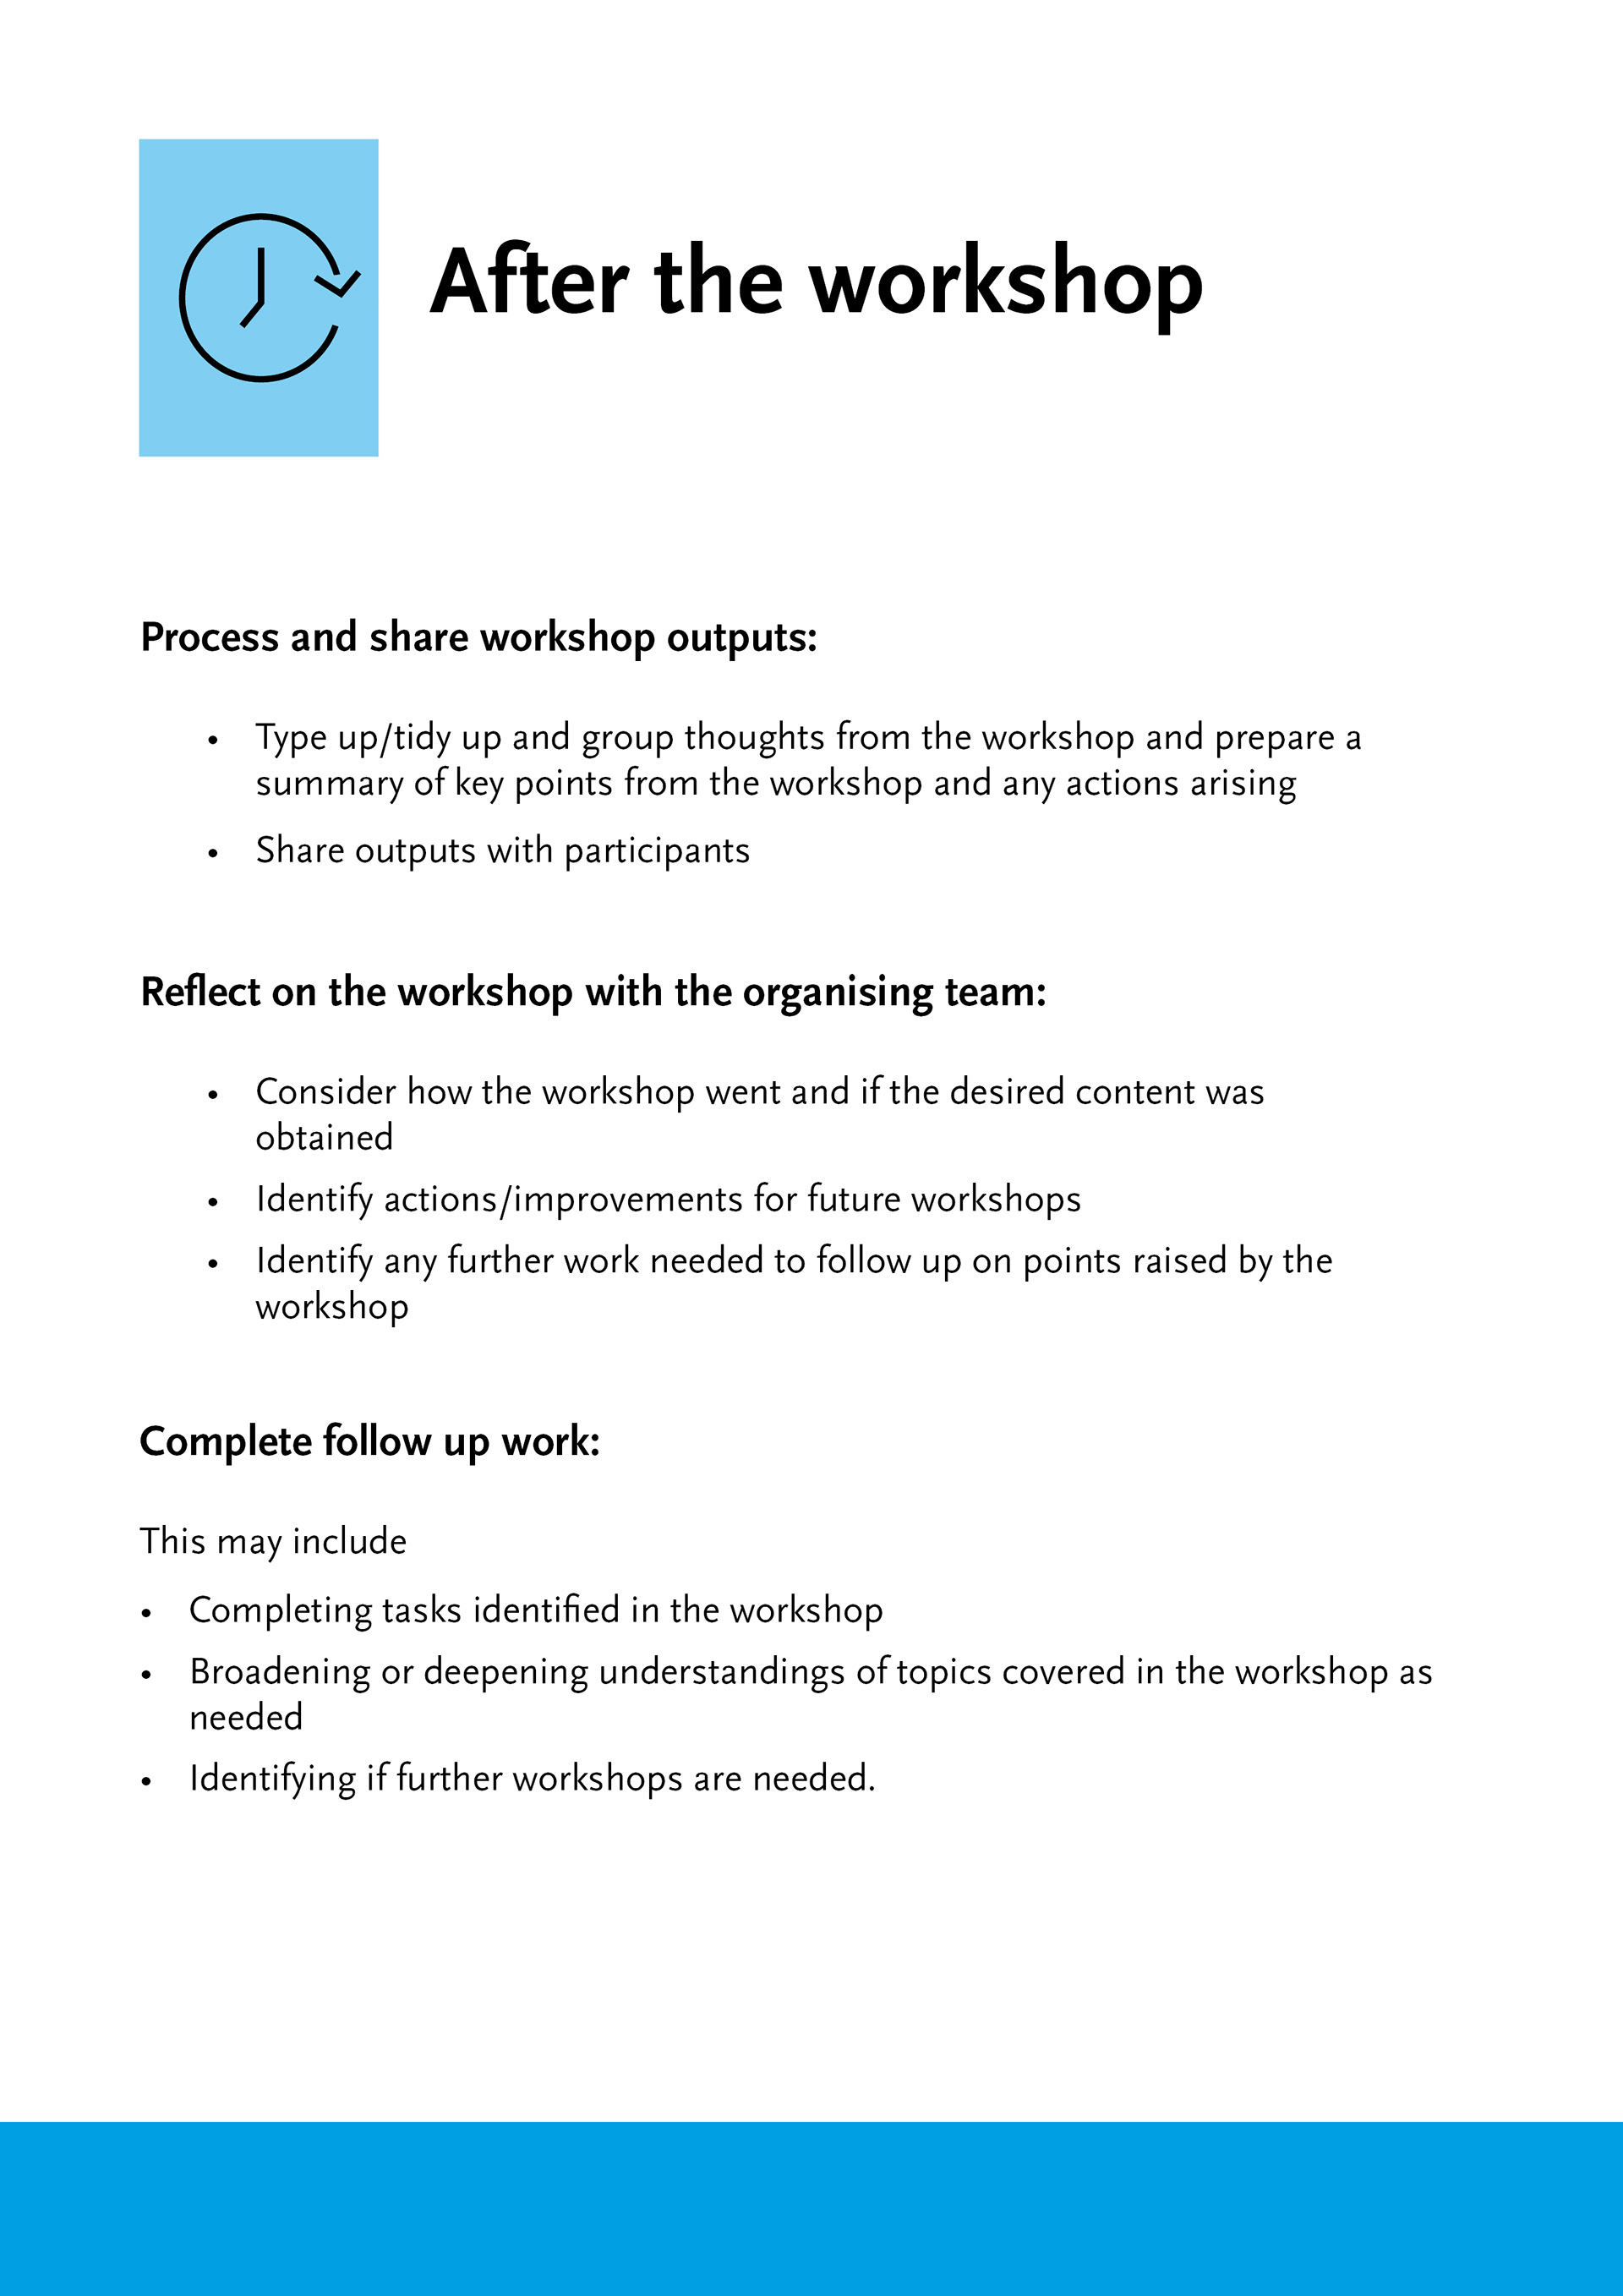
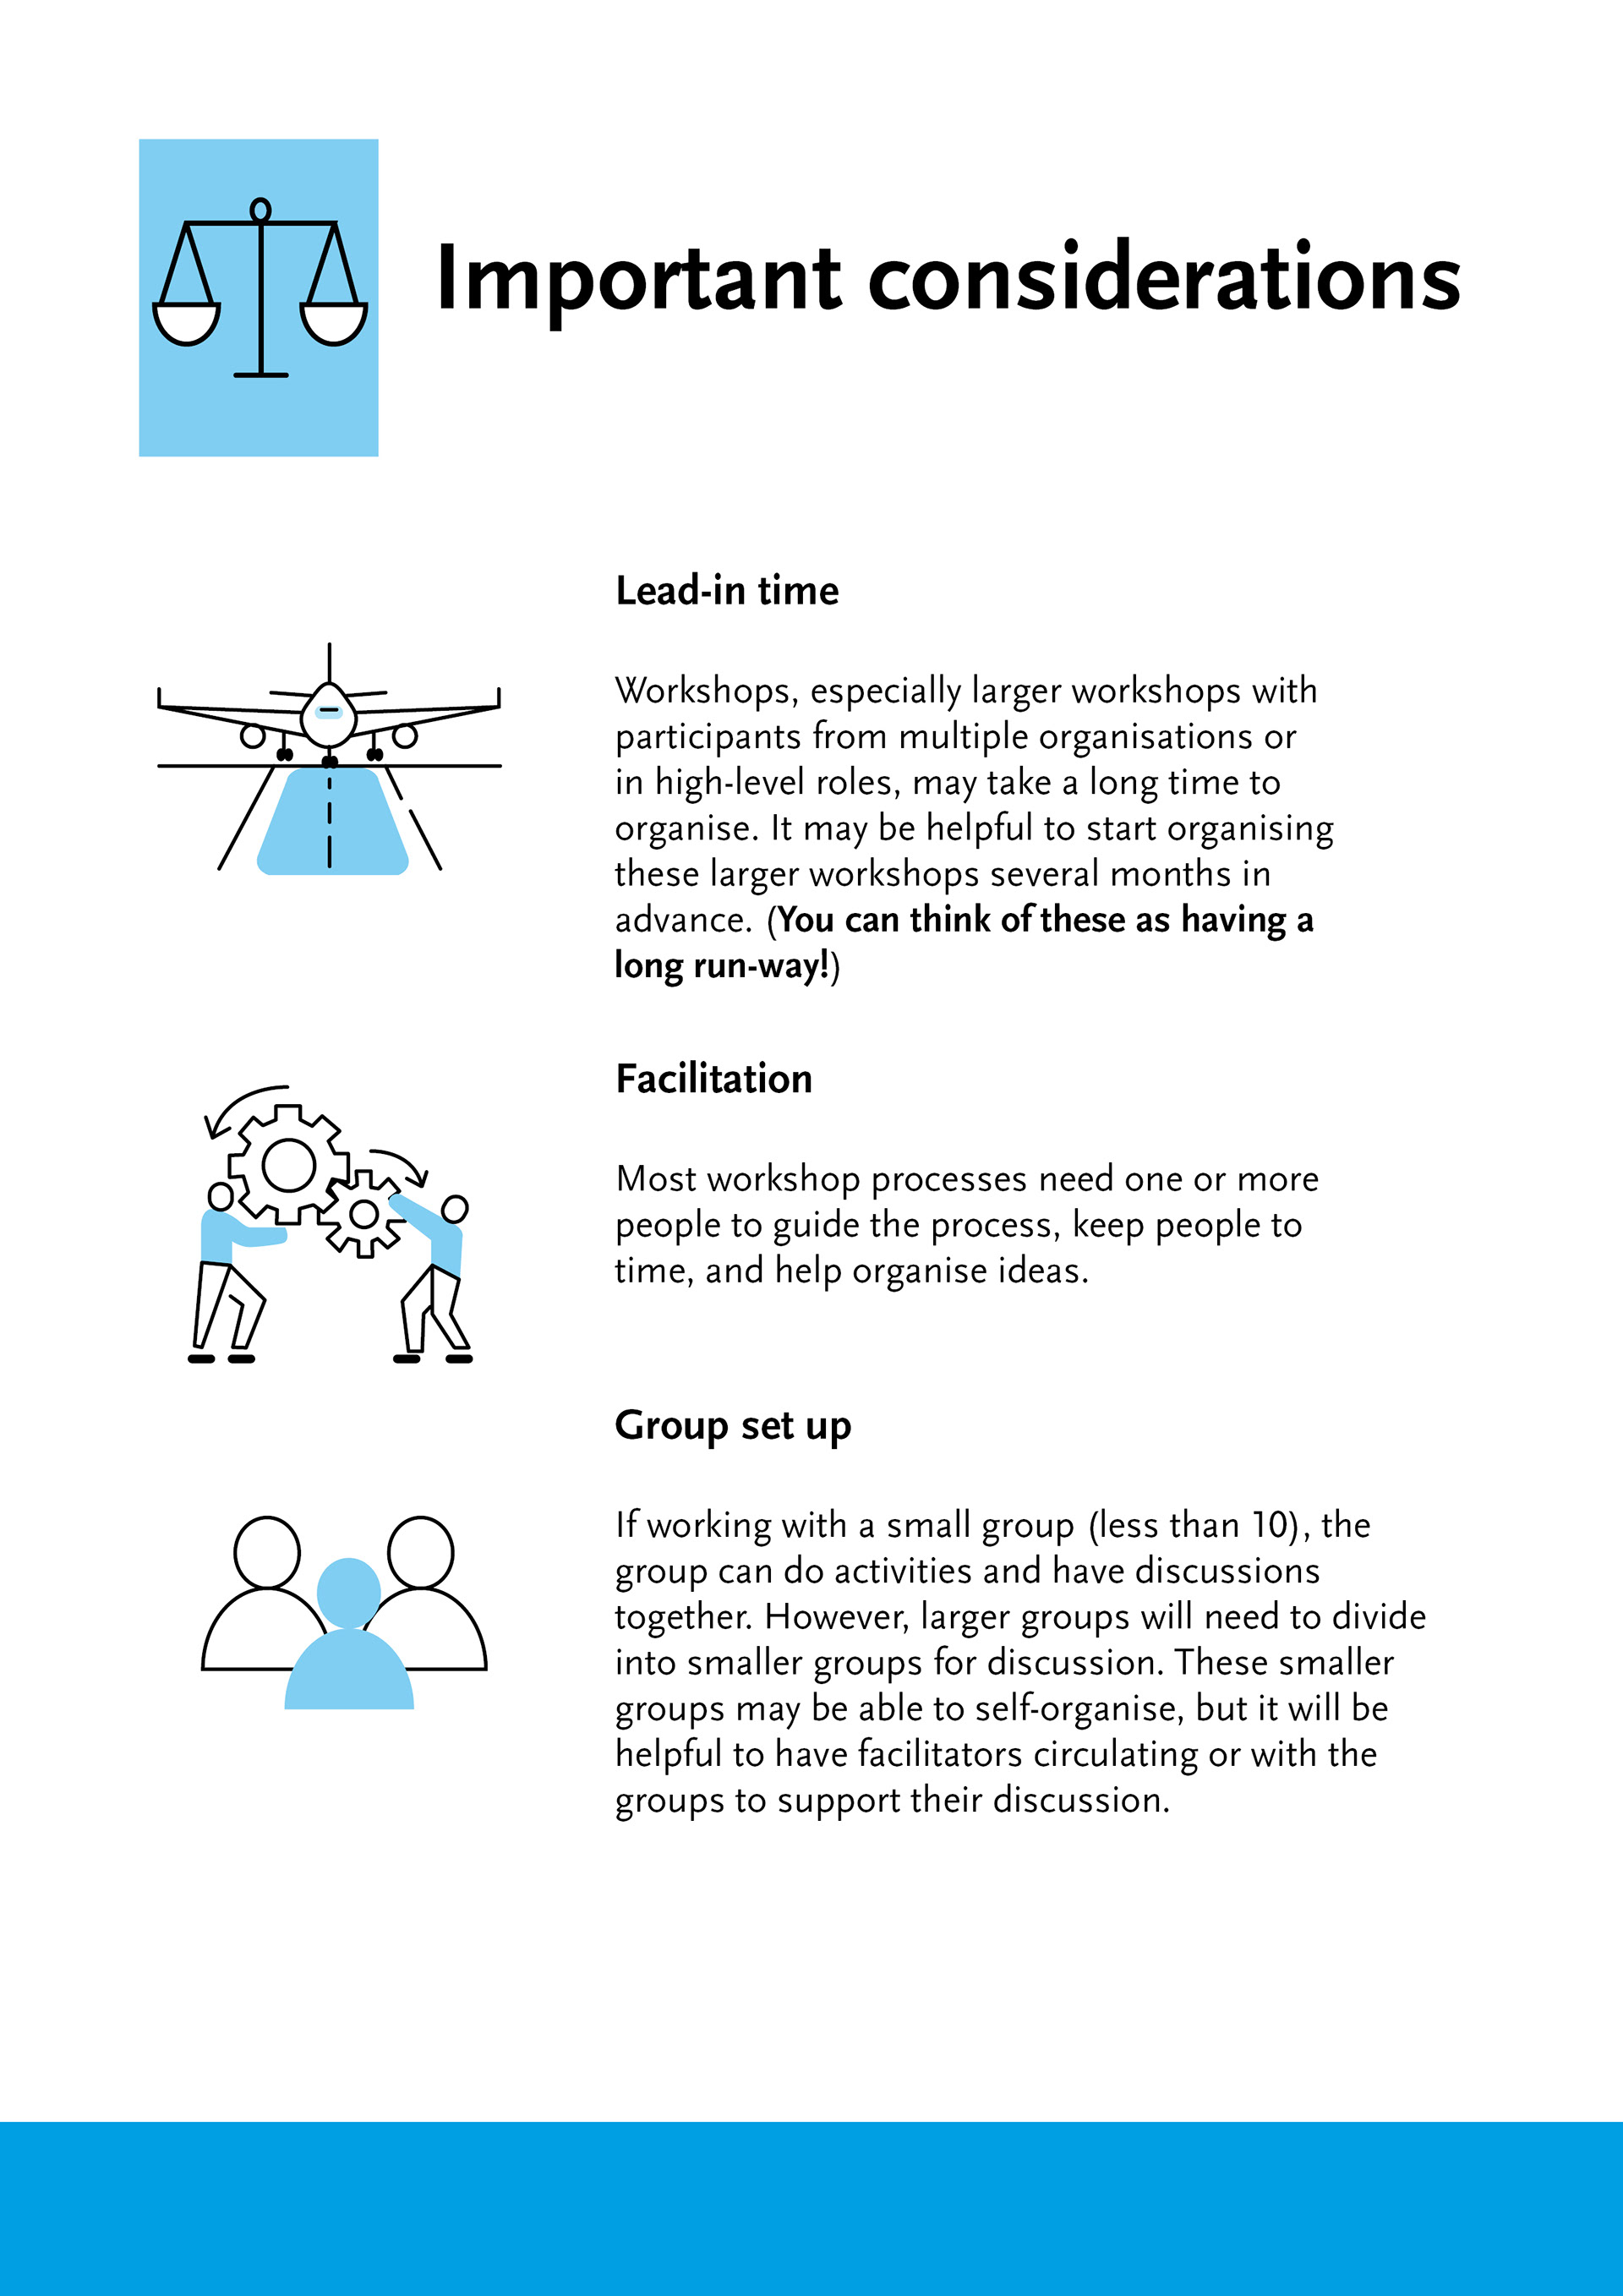
Creating a range of guides to explain certain tools or to allow project leaders to be better equipped for running workshops.
Reformatting relevant research papers and run sheets that would be a part of the toolkit. Giving them a new 'freshness'.
Creating infographic and visual components that enhanced the readability of information, and increased engagement.
Figuring out how all the created tools, guides, run sheets, and research papers would be accessed together. What would be the user journey, and would it be a PDF or a webpage?
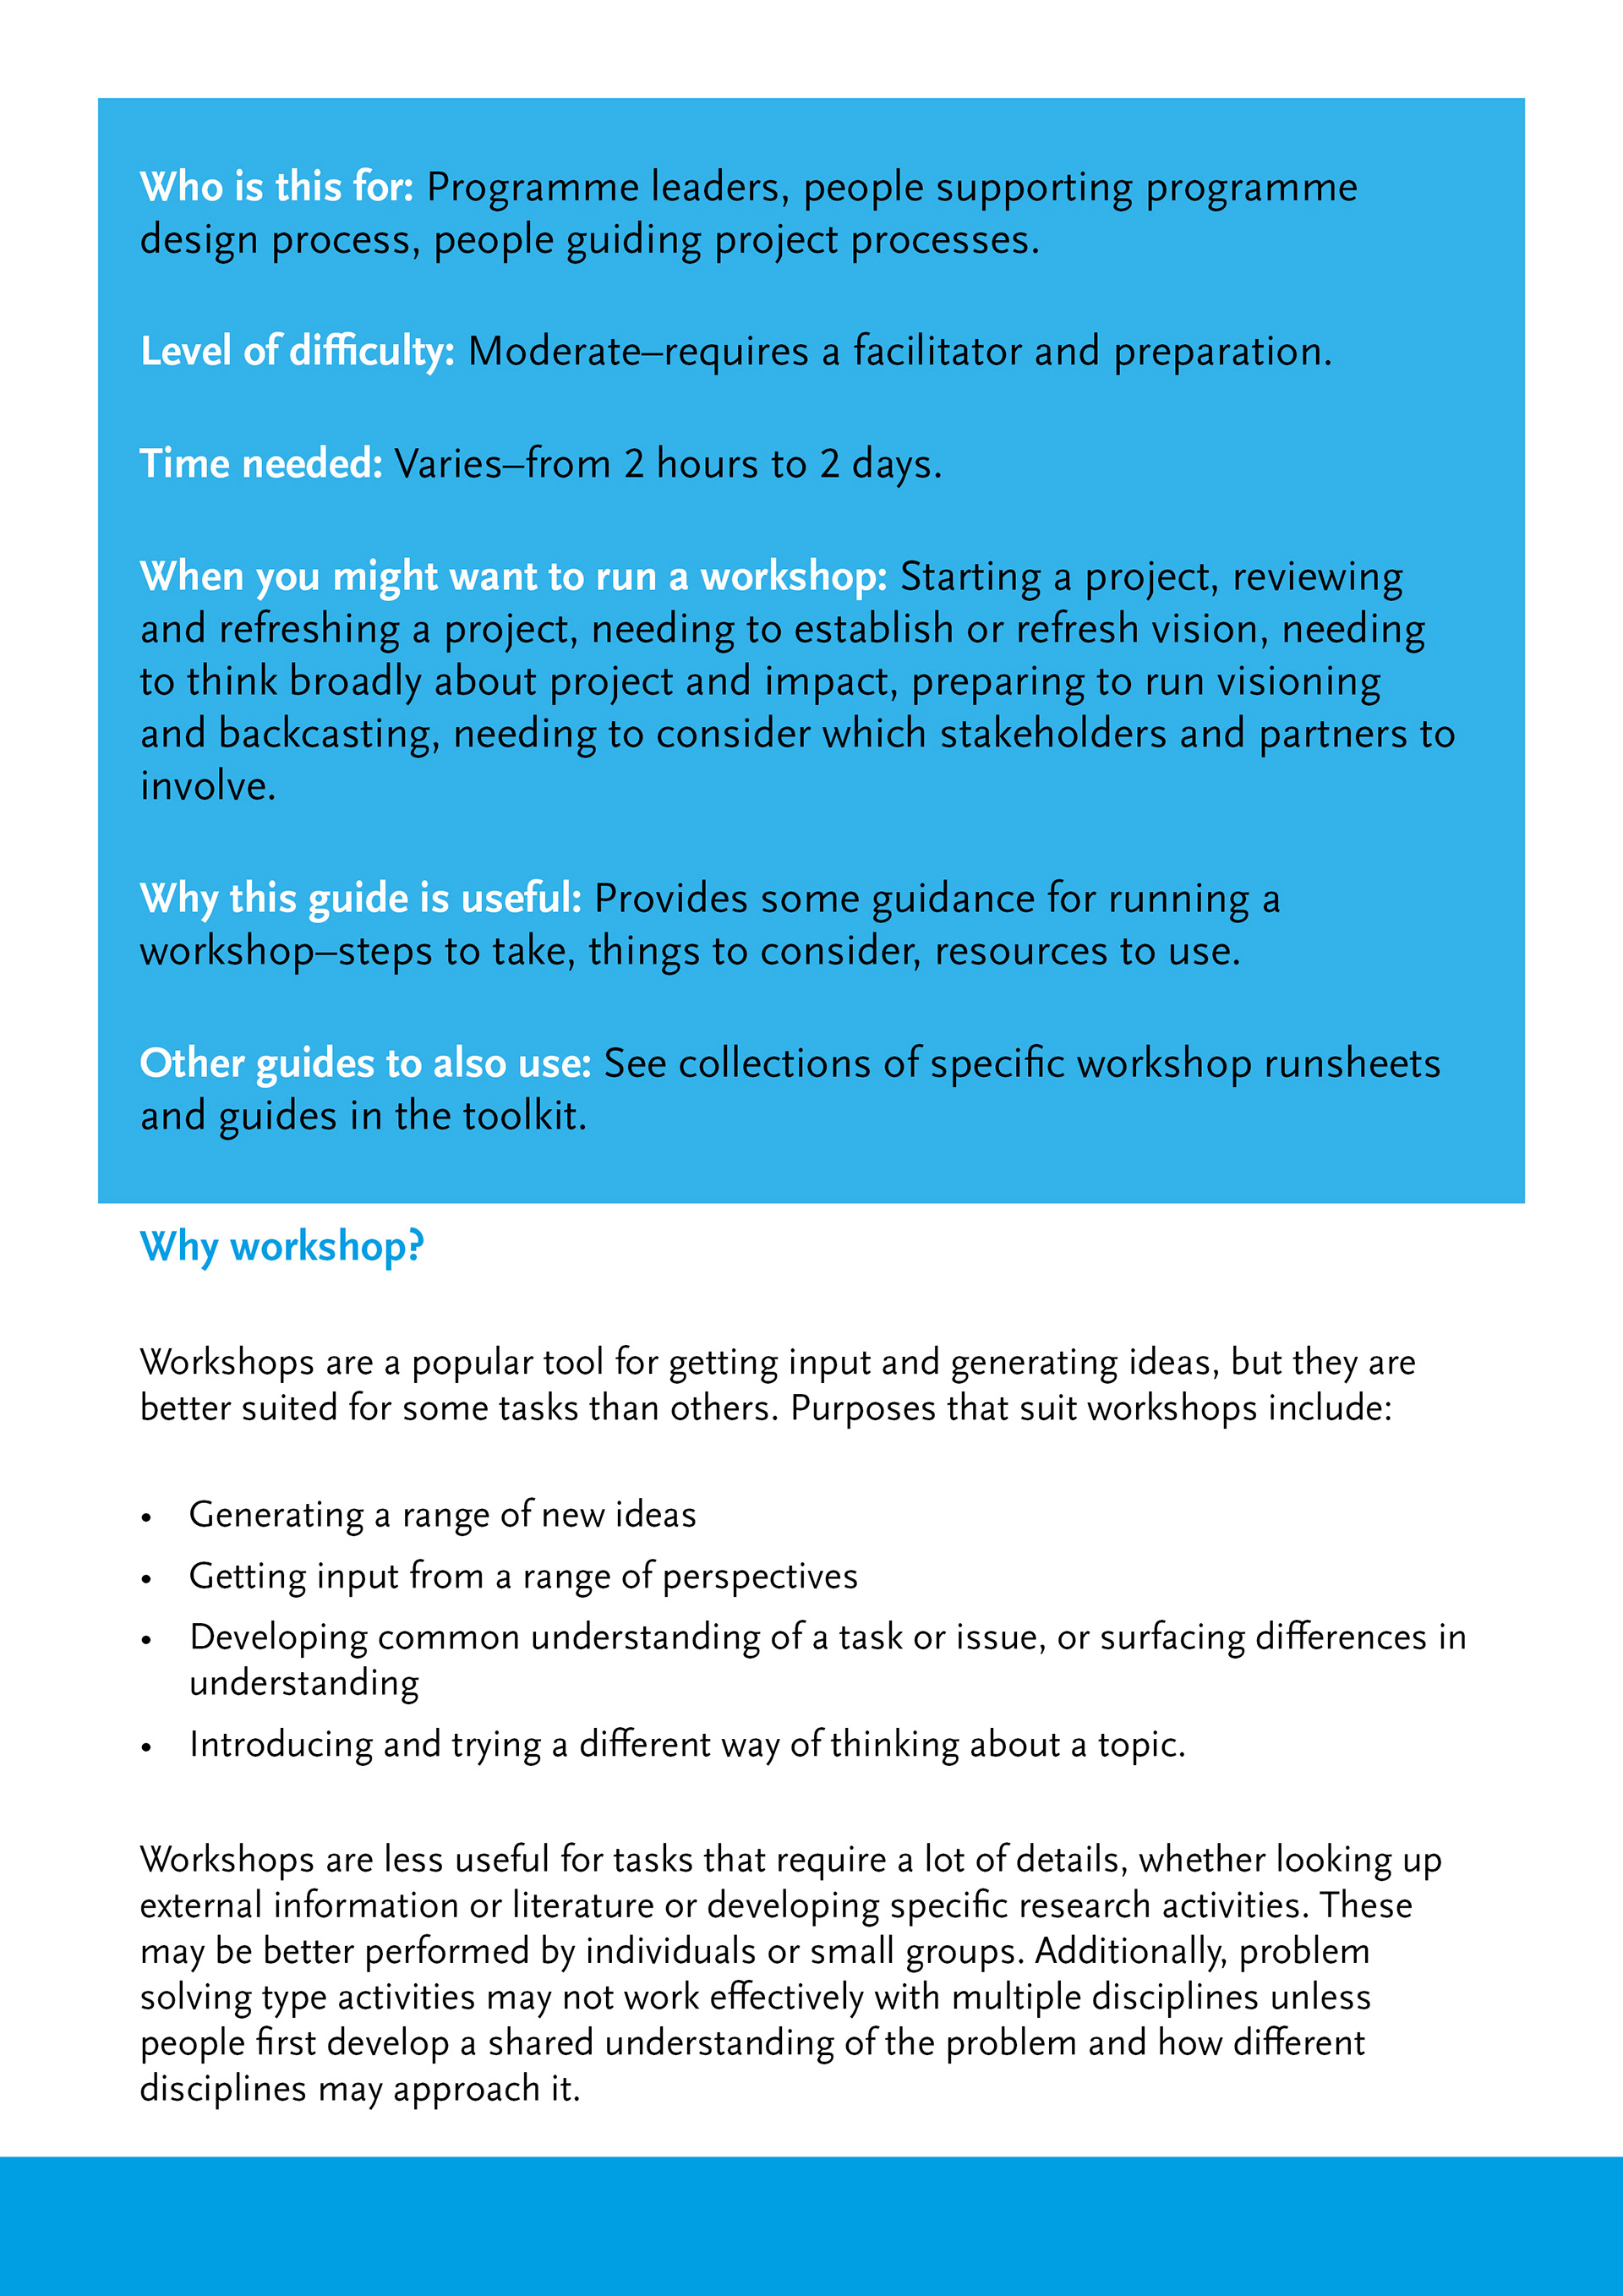
Below is an example of learning how to deliver a successful outcome to different requests.
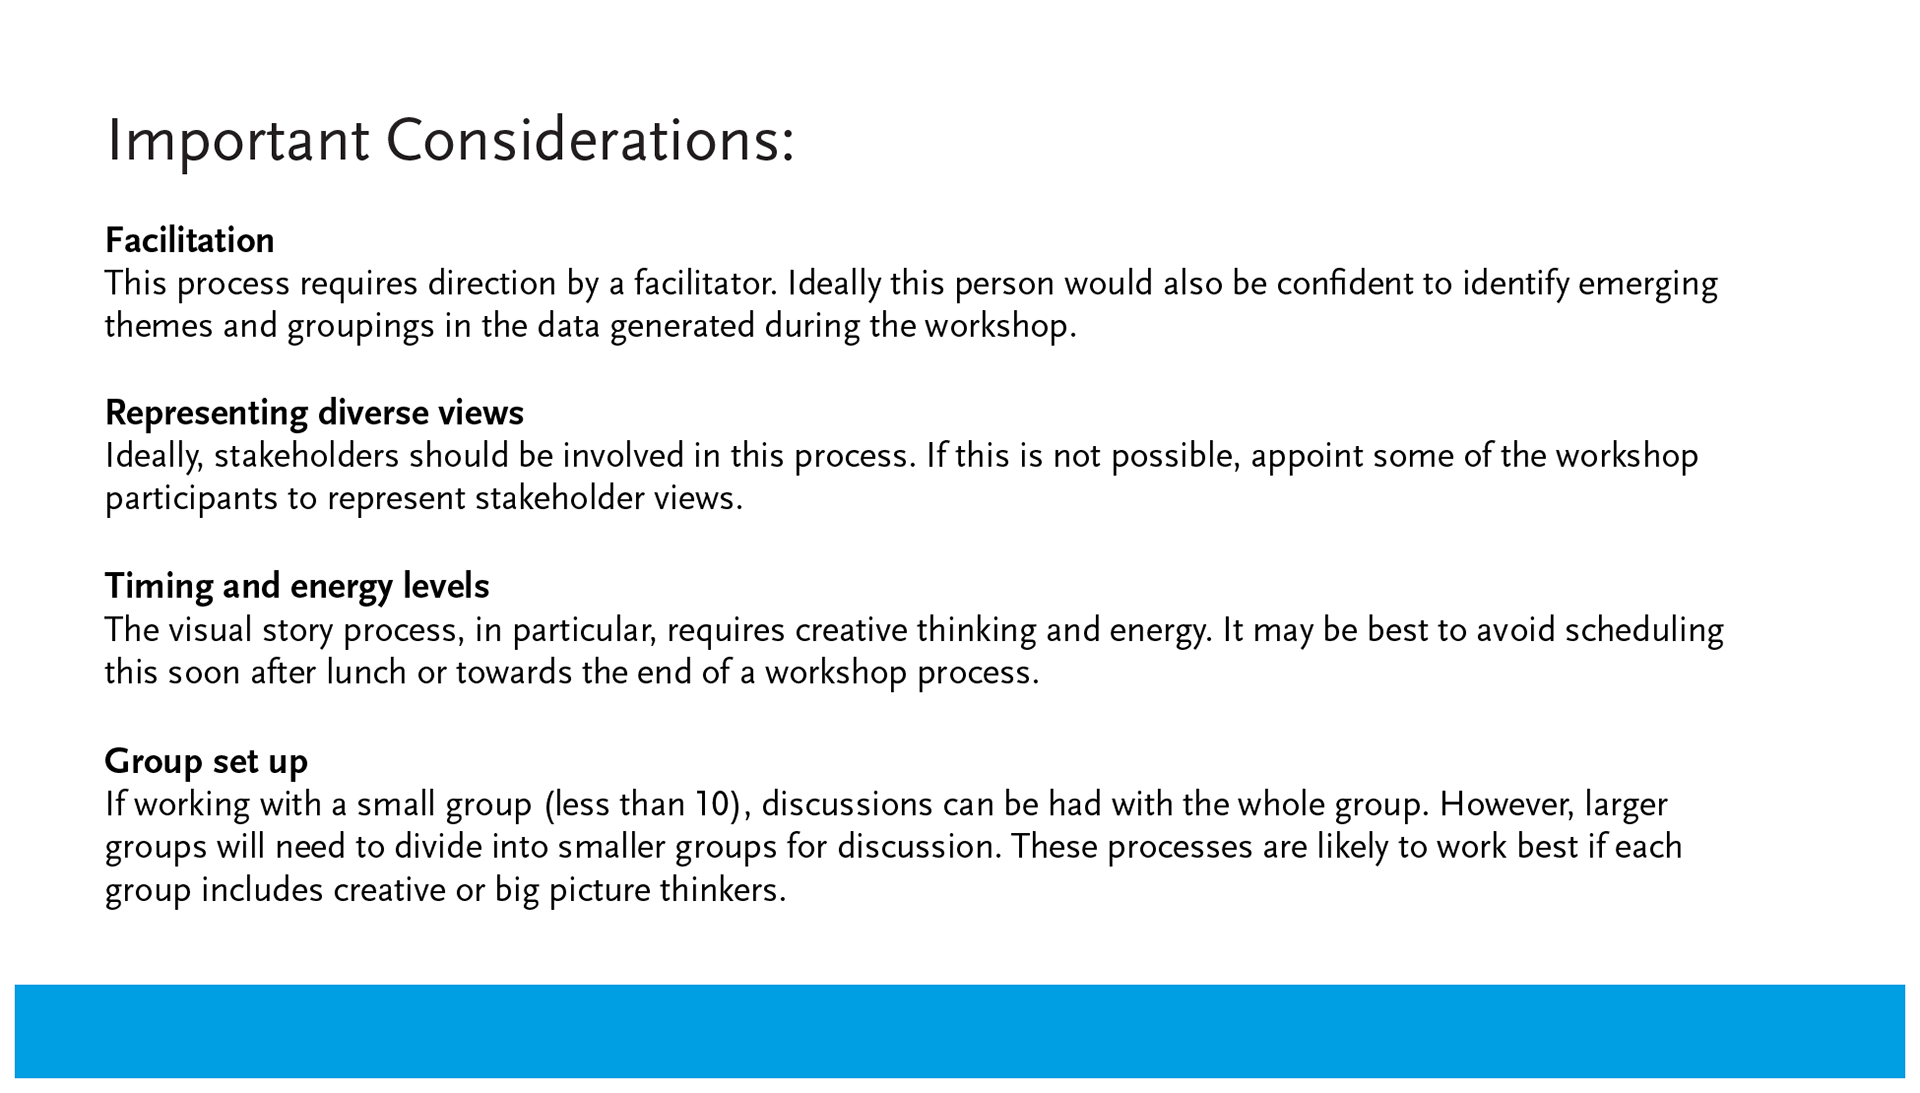
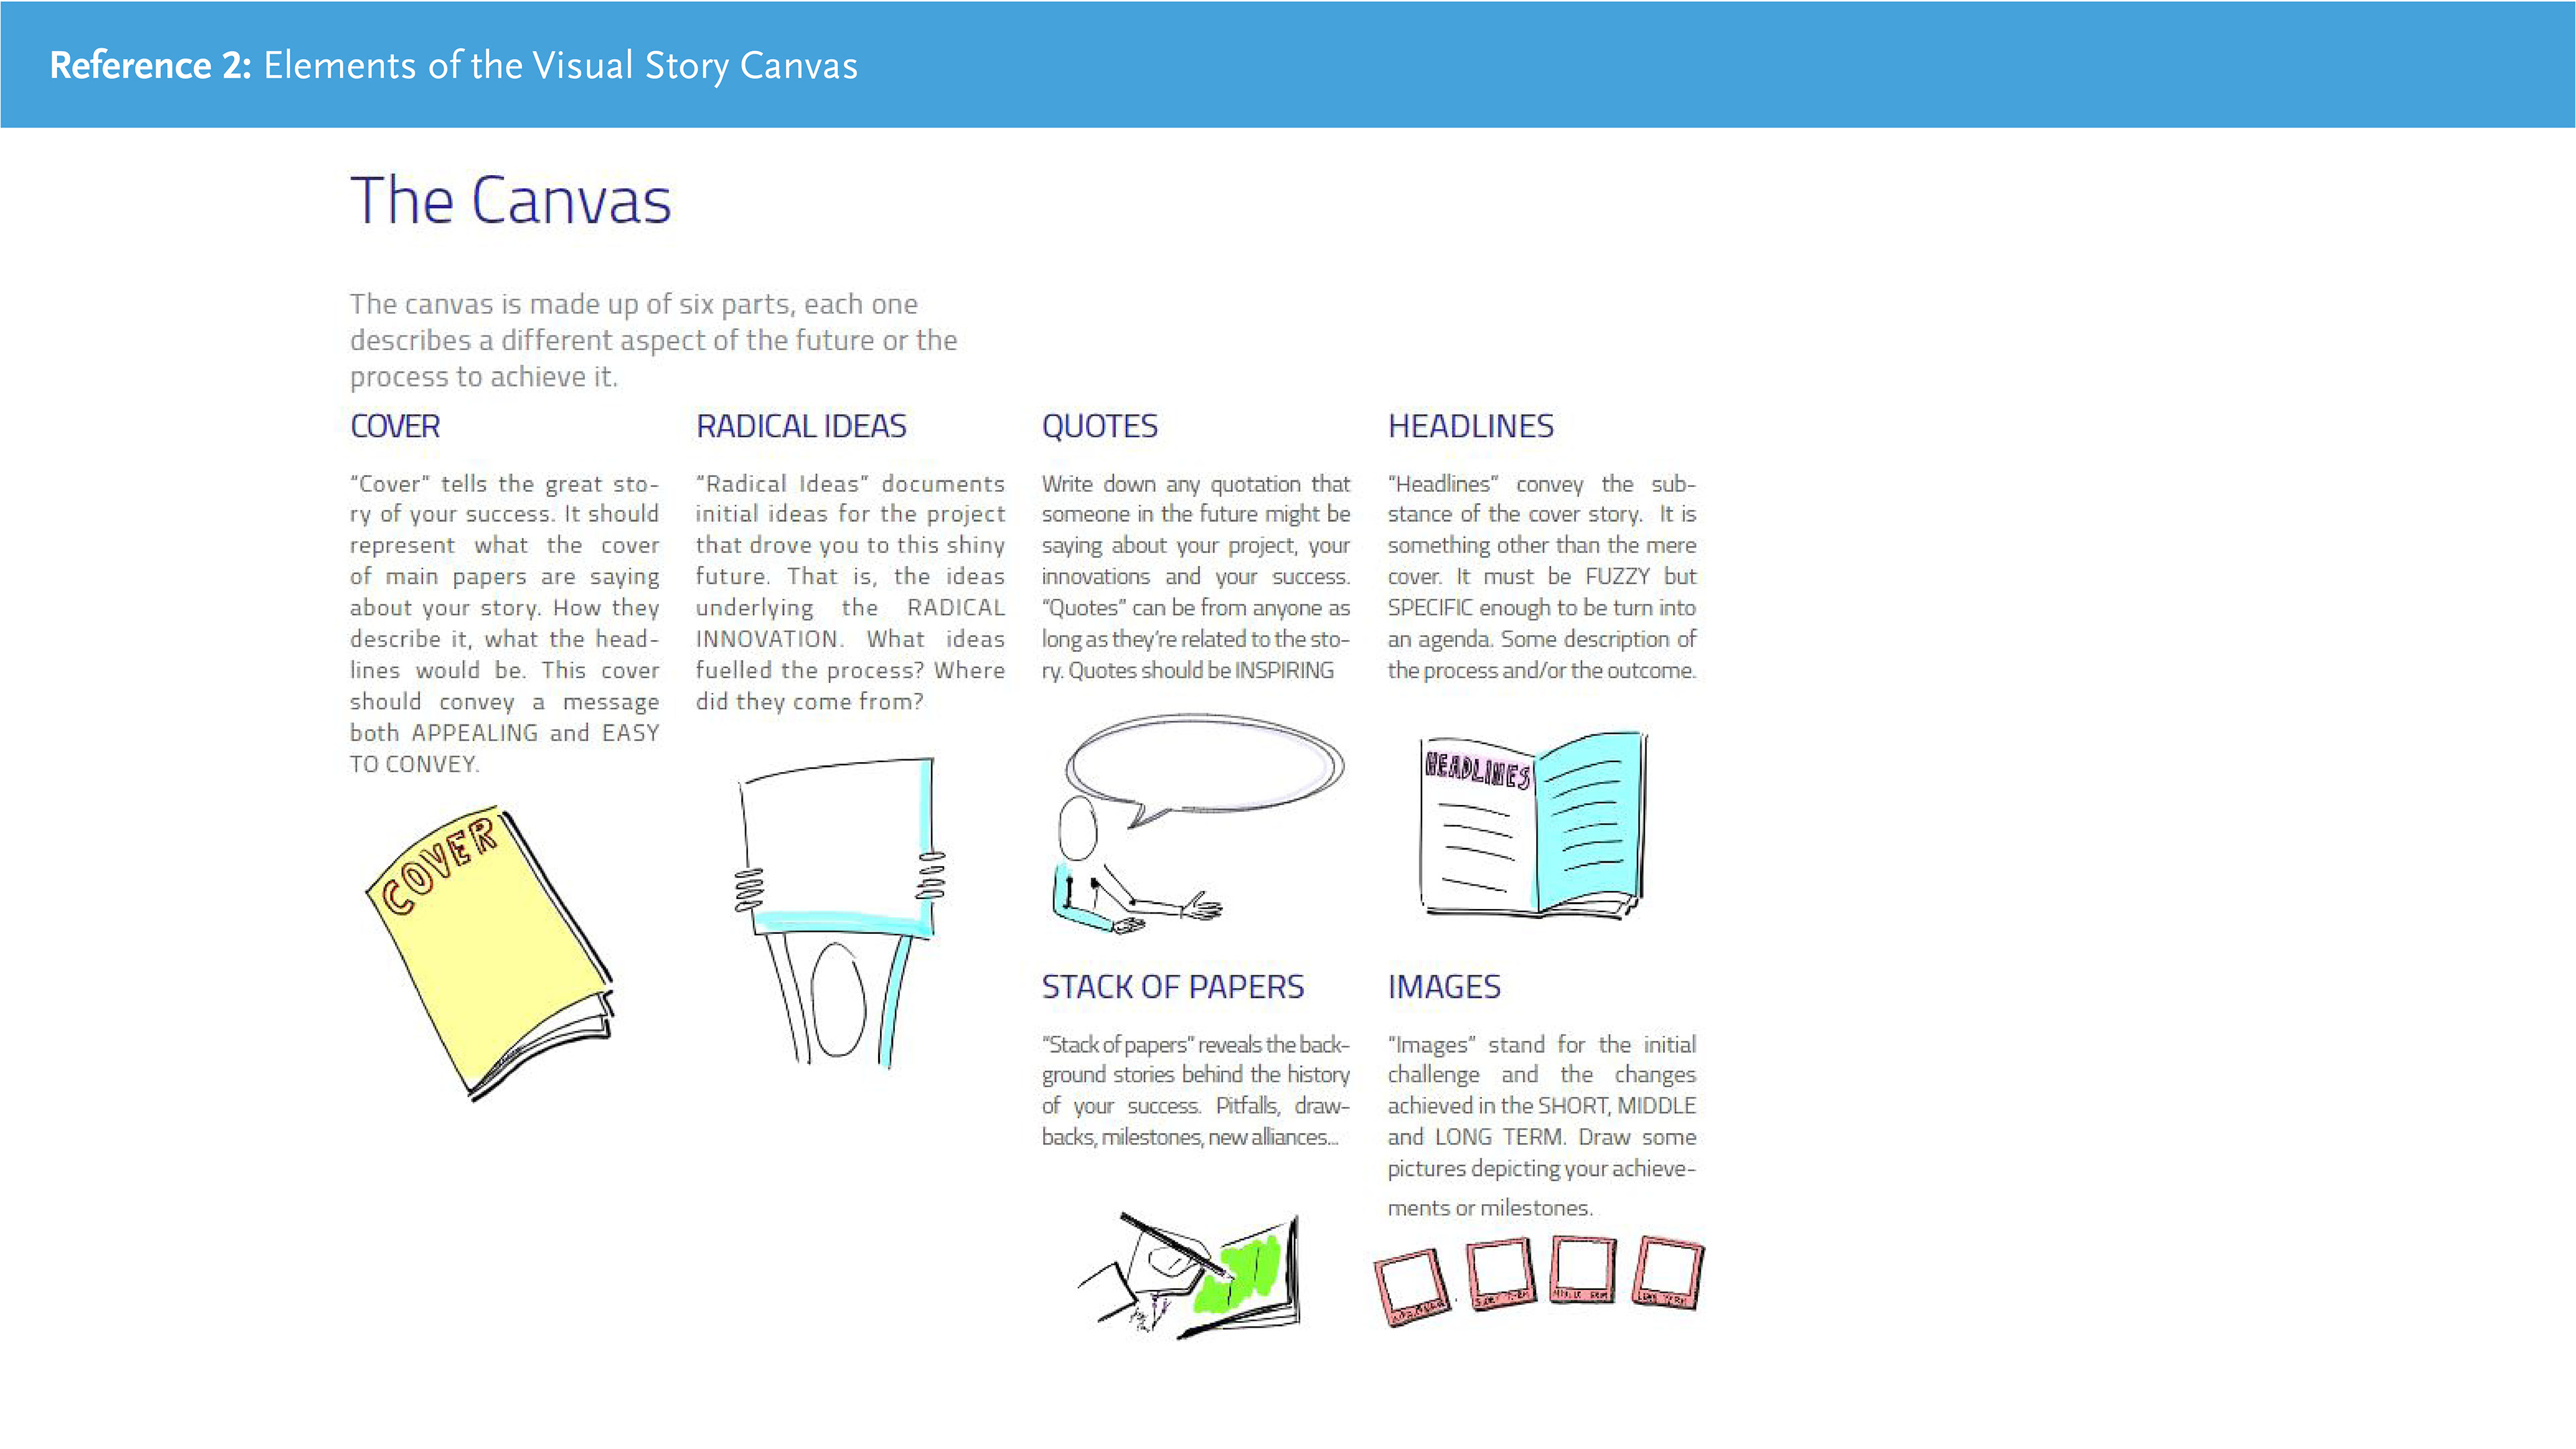
The infographic was created for those more confident and experienced with running workshops. These people would only require a quick reminder about certain aspects, and wouldn't want to be given too much information.
The guide was created for those who preferred to be given as much information as possible. It was made as a separate component that could then be used alongside other tools and resources instead of having all of this information as part of every tool we created.
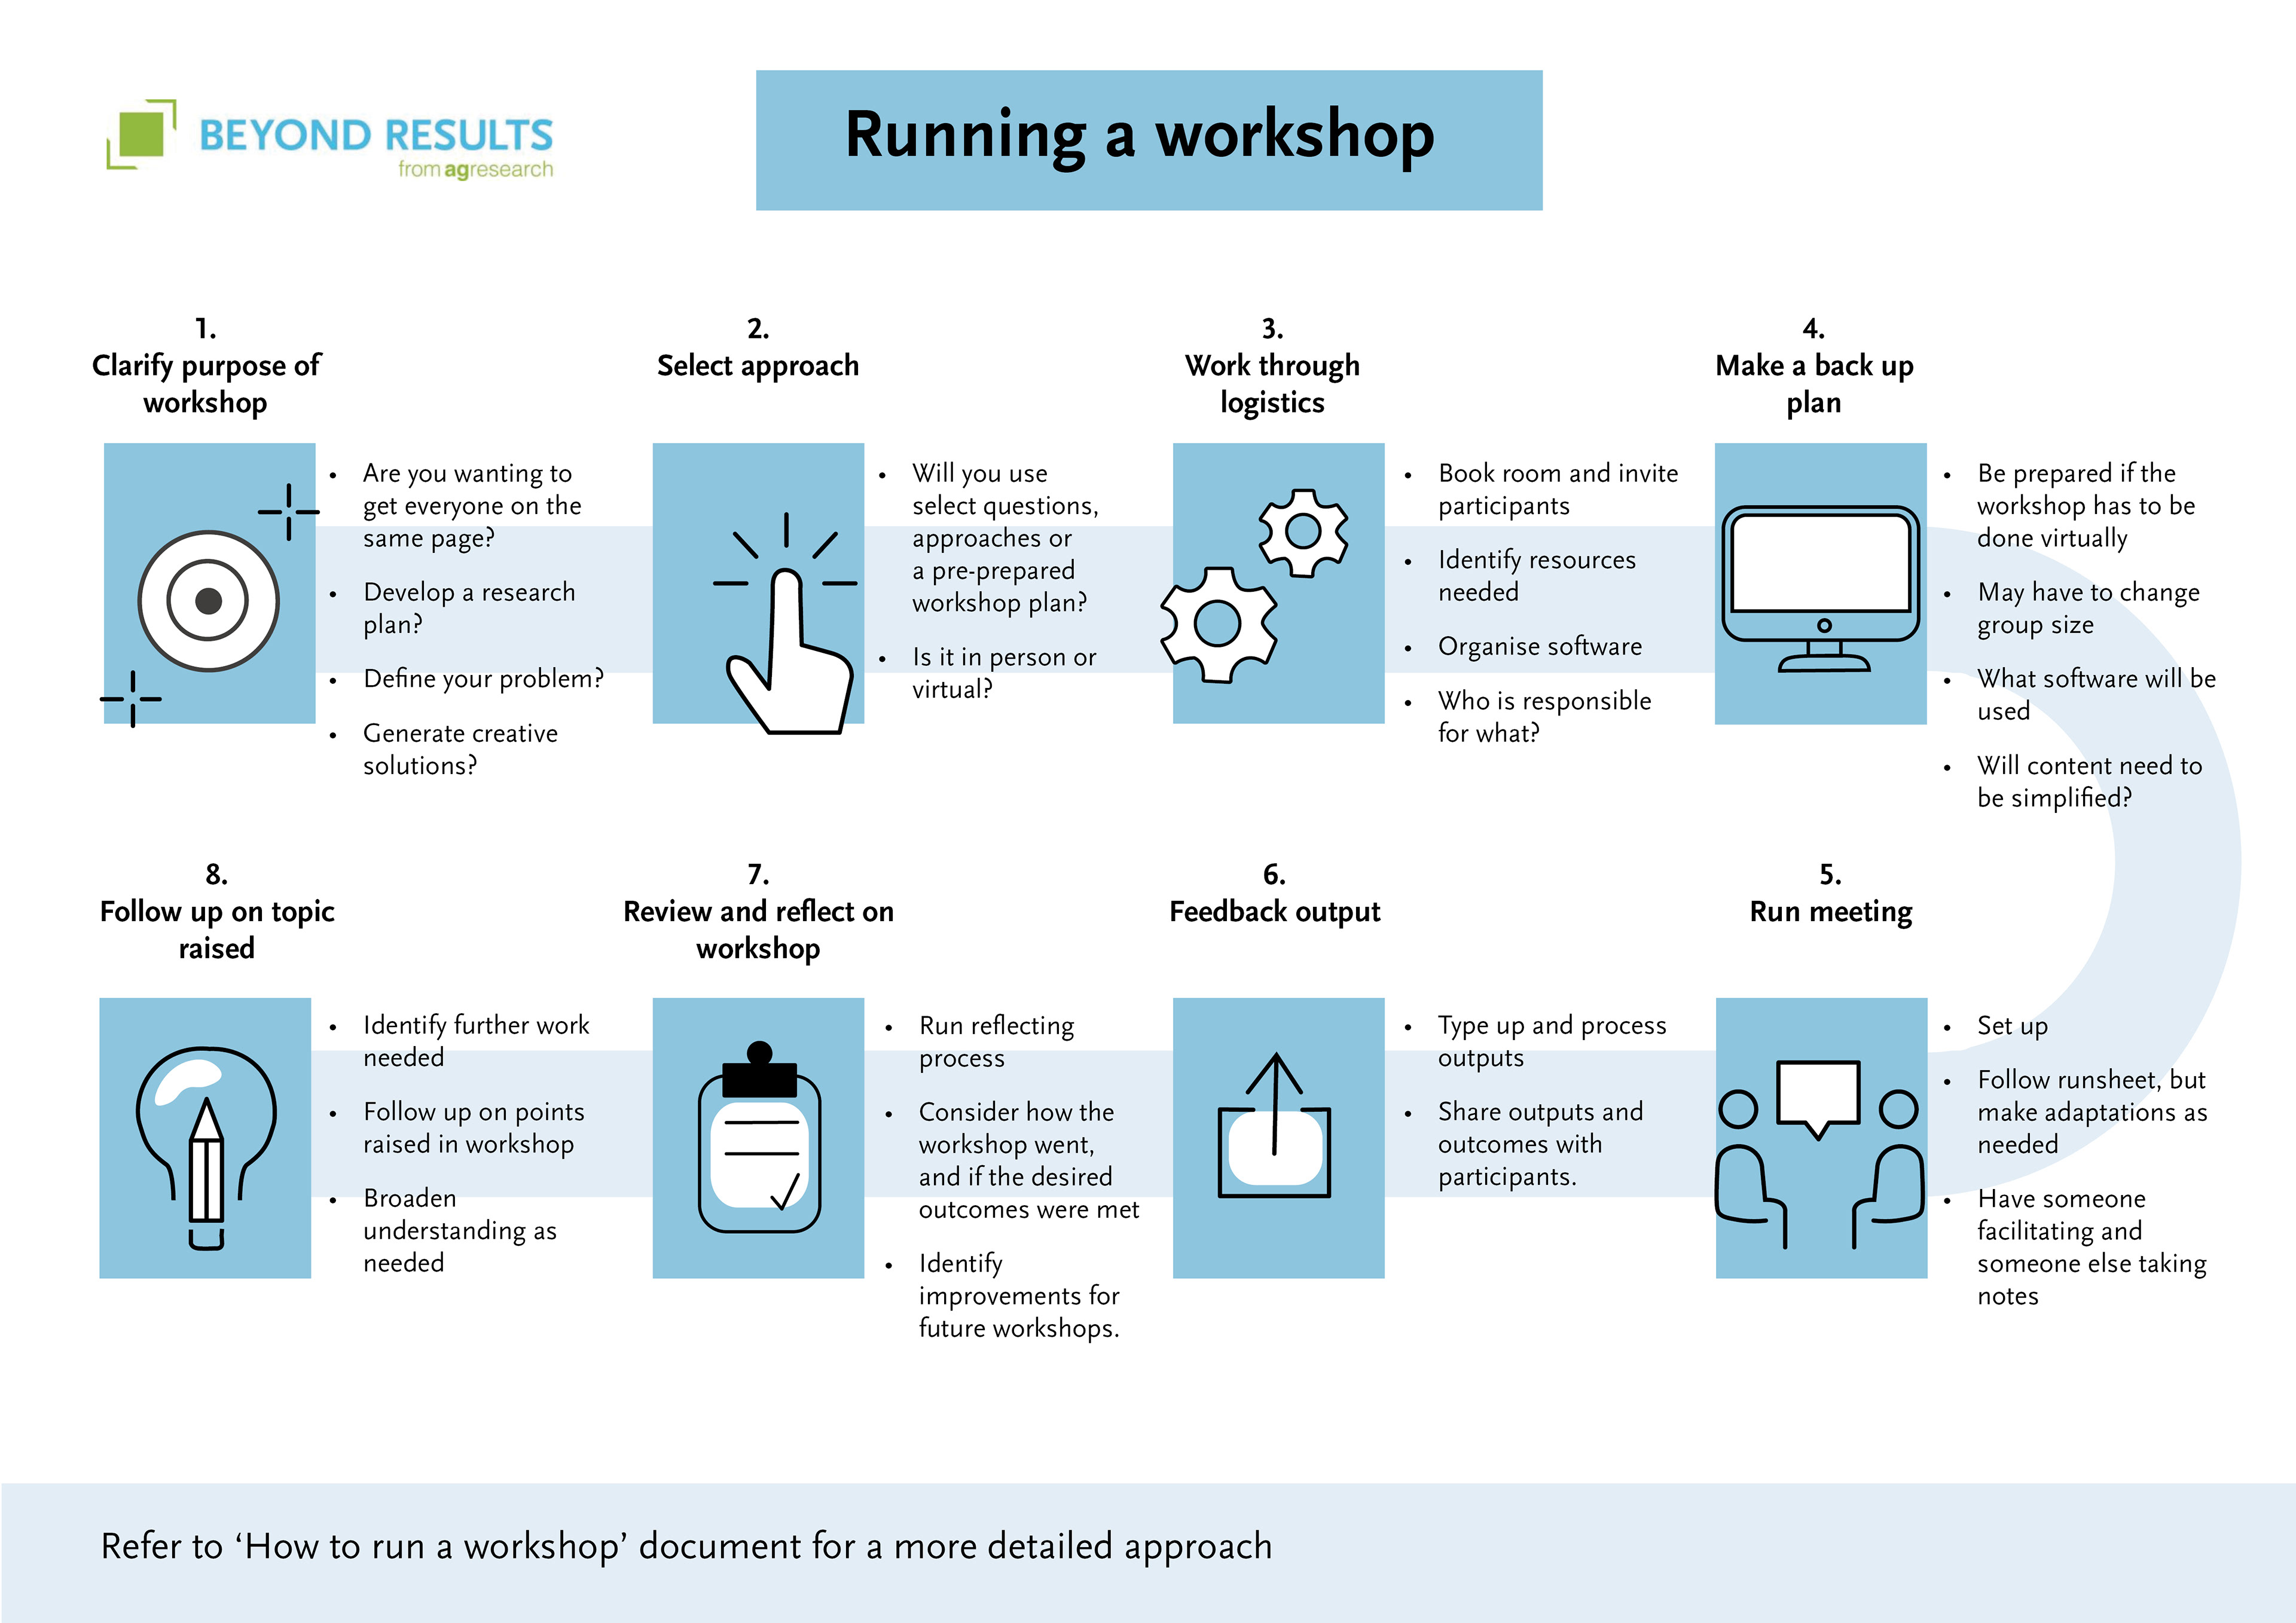
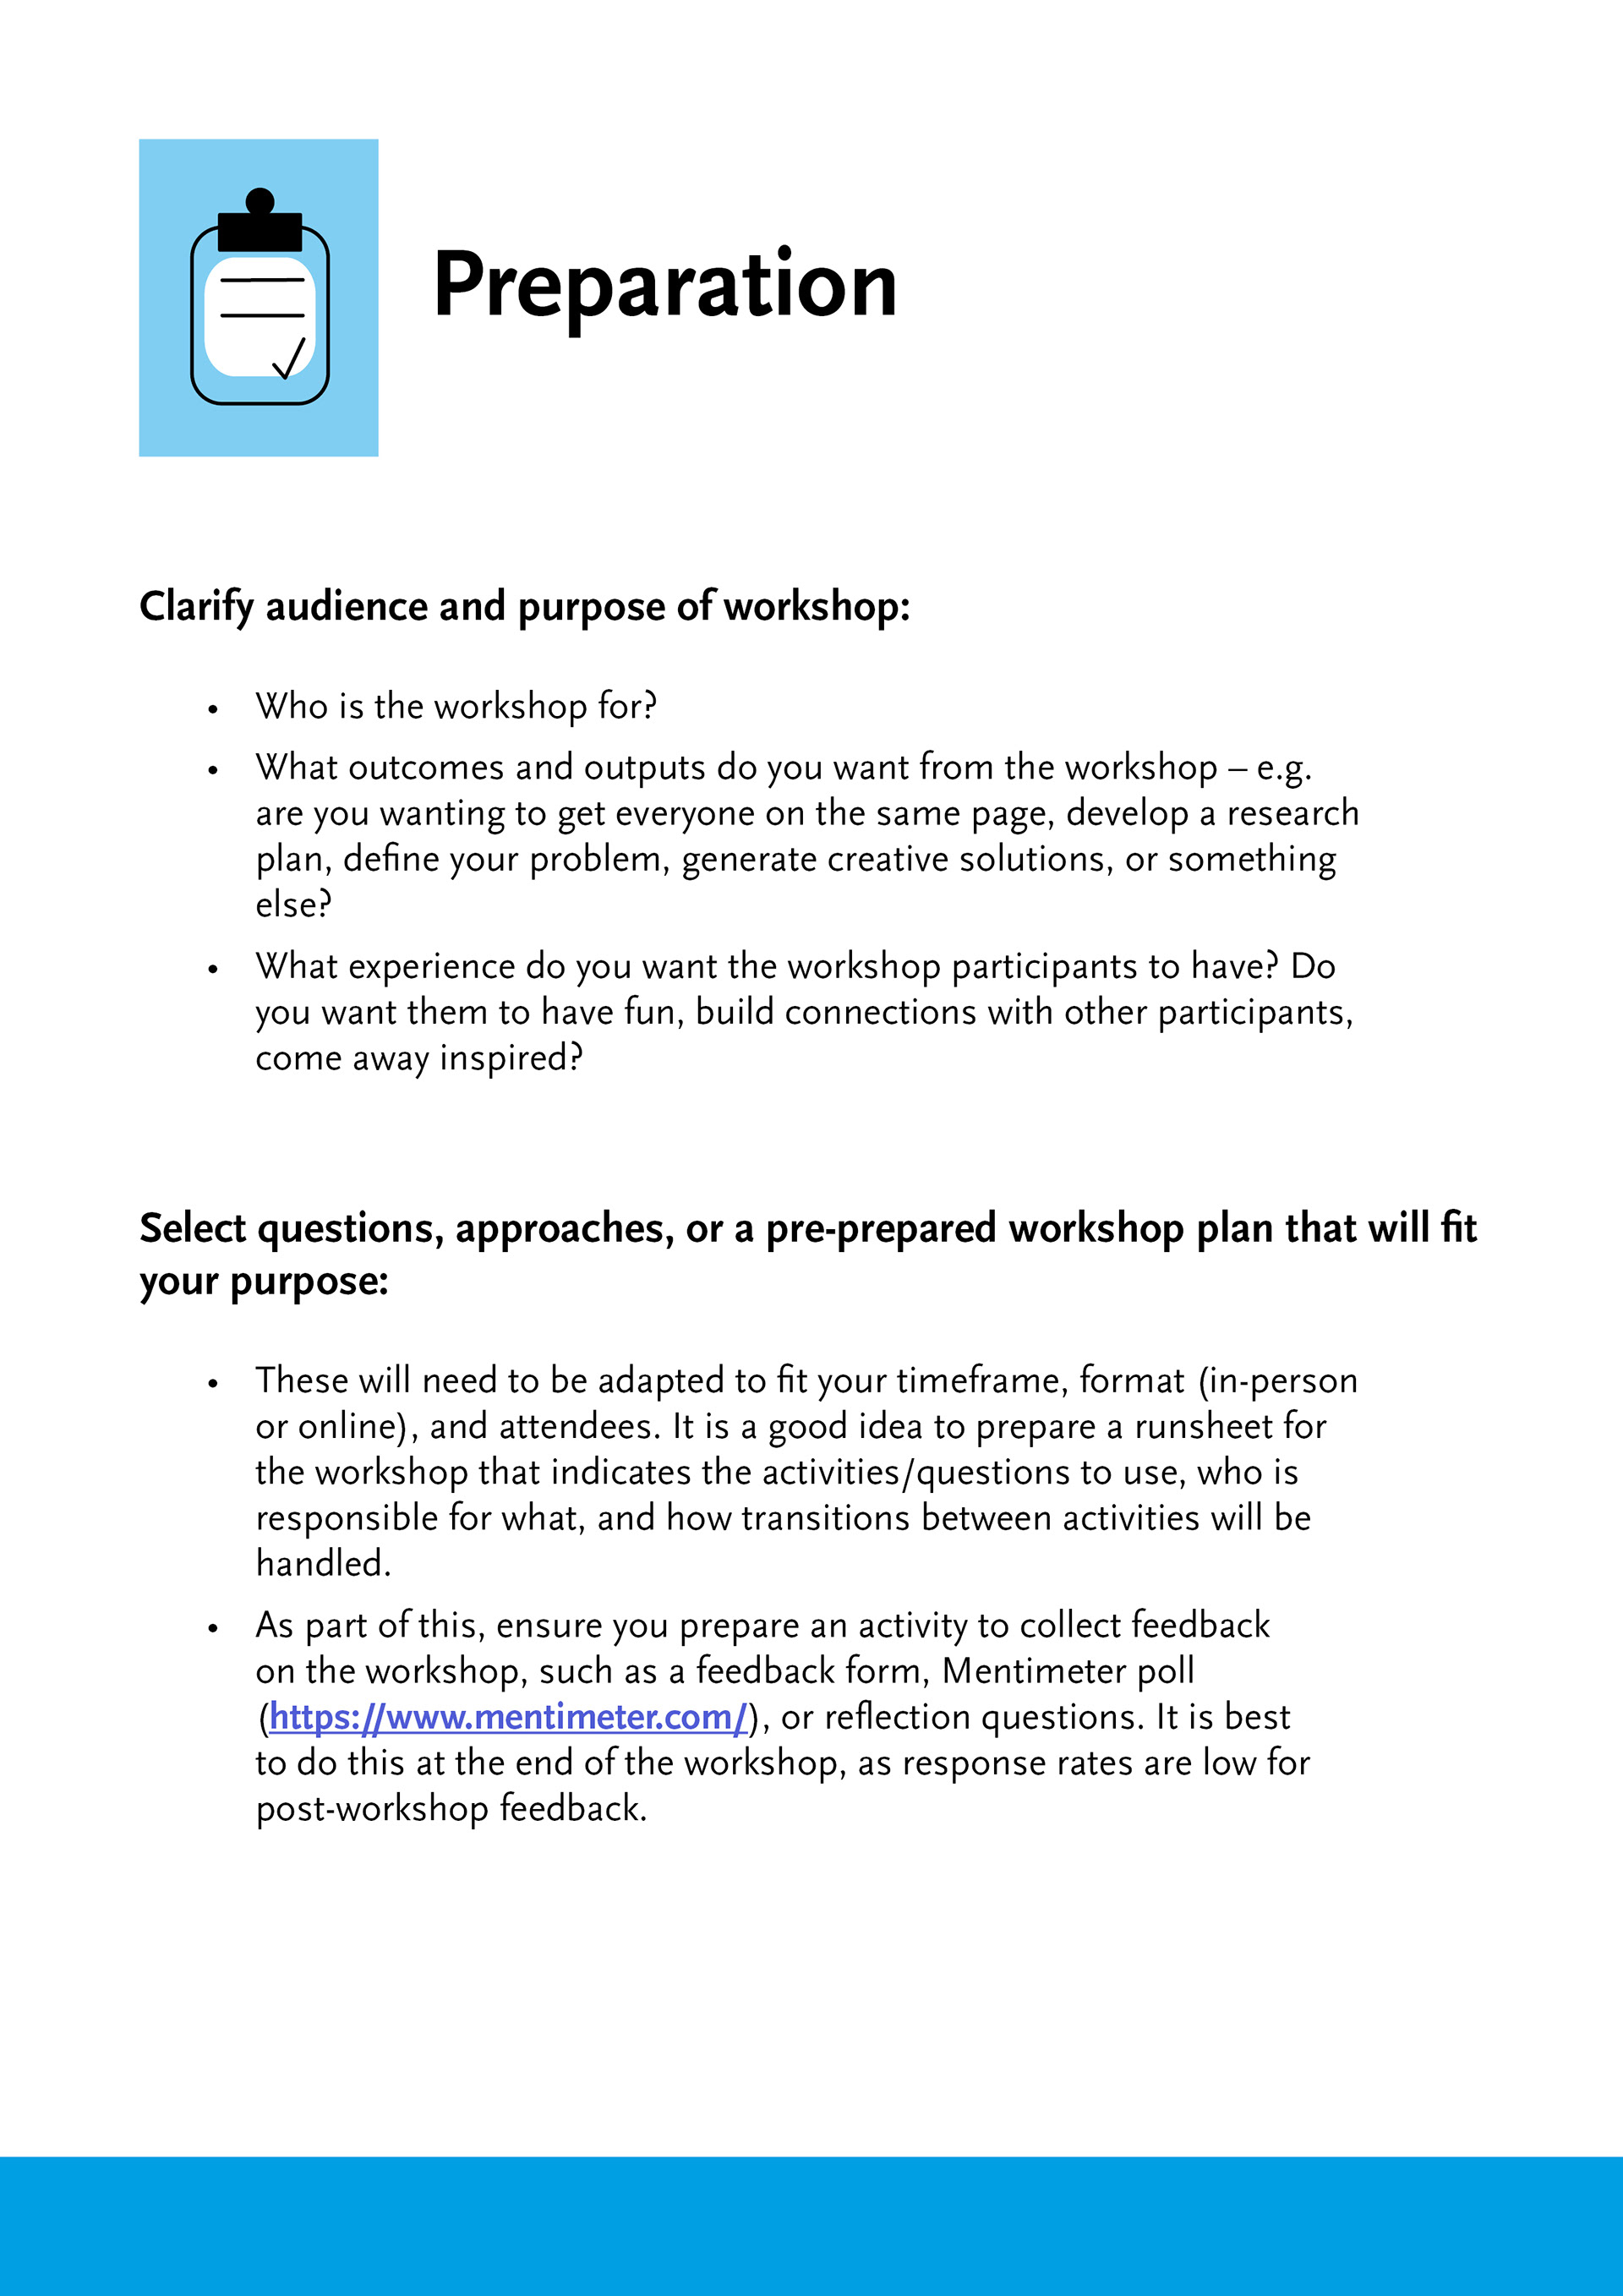
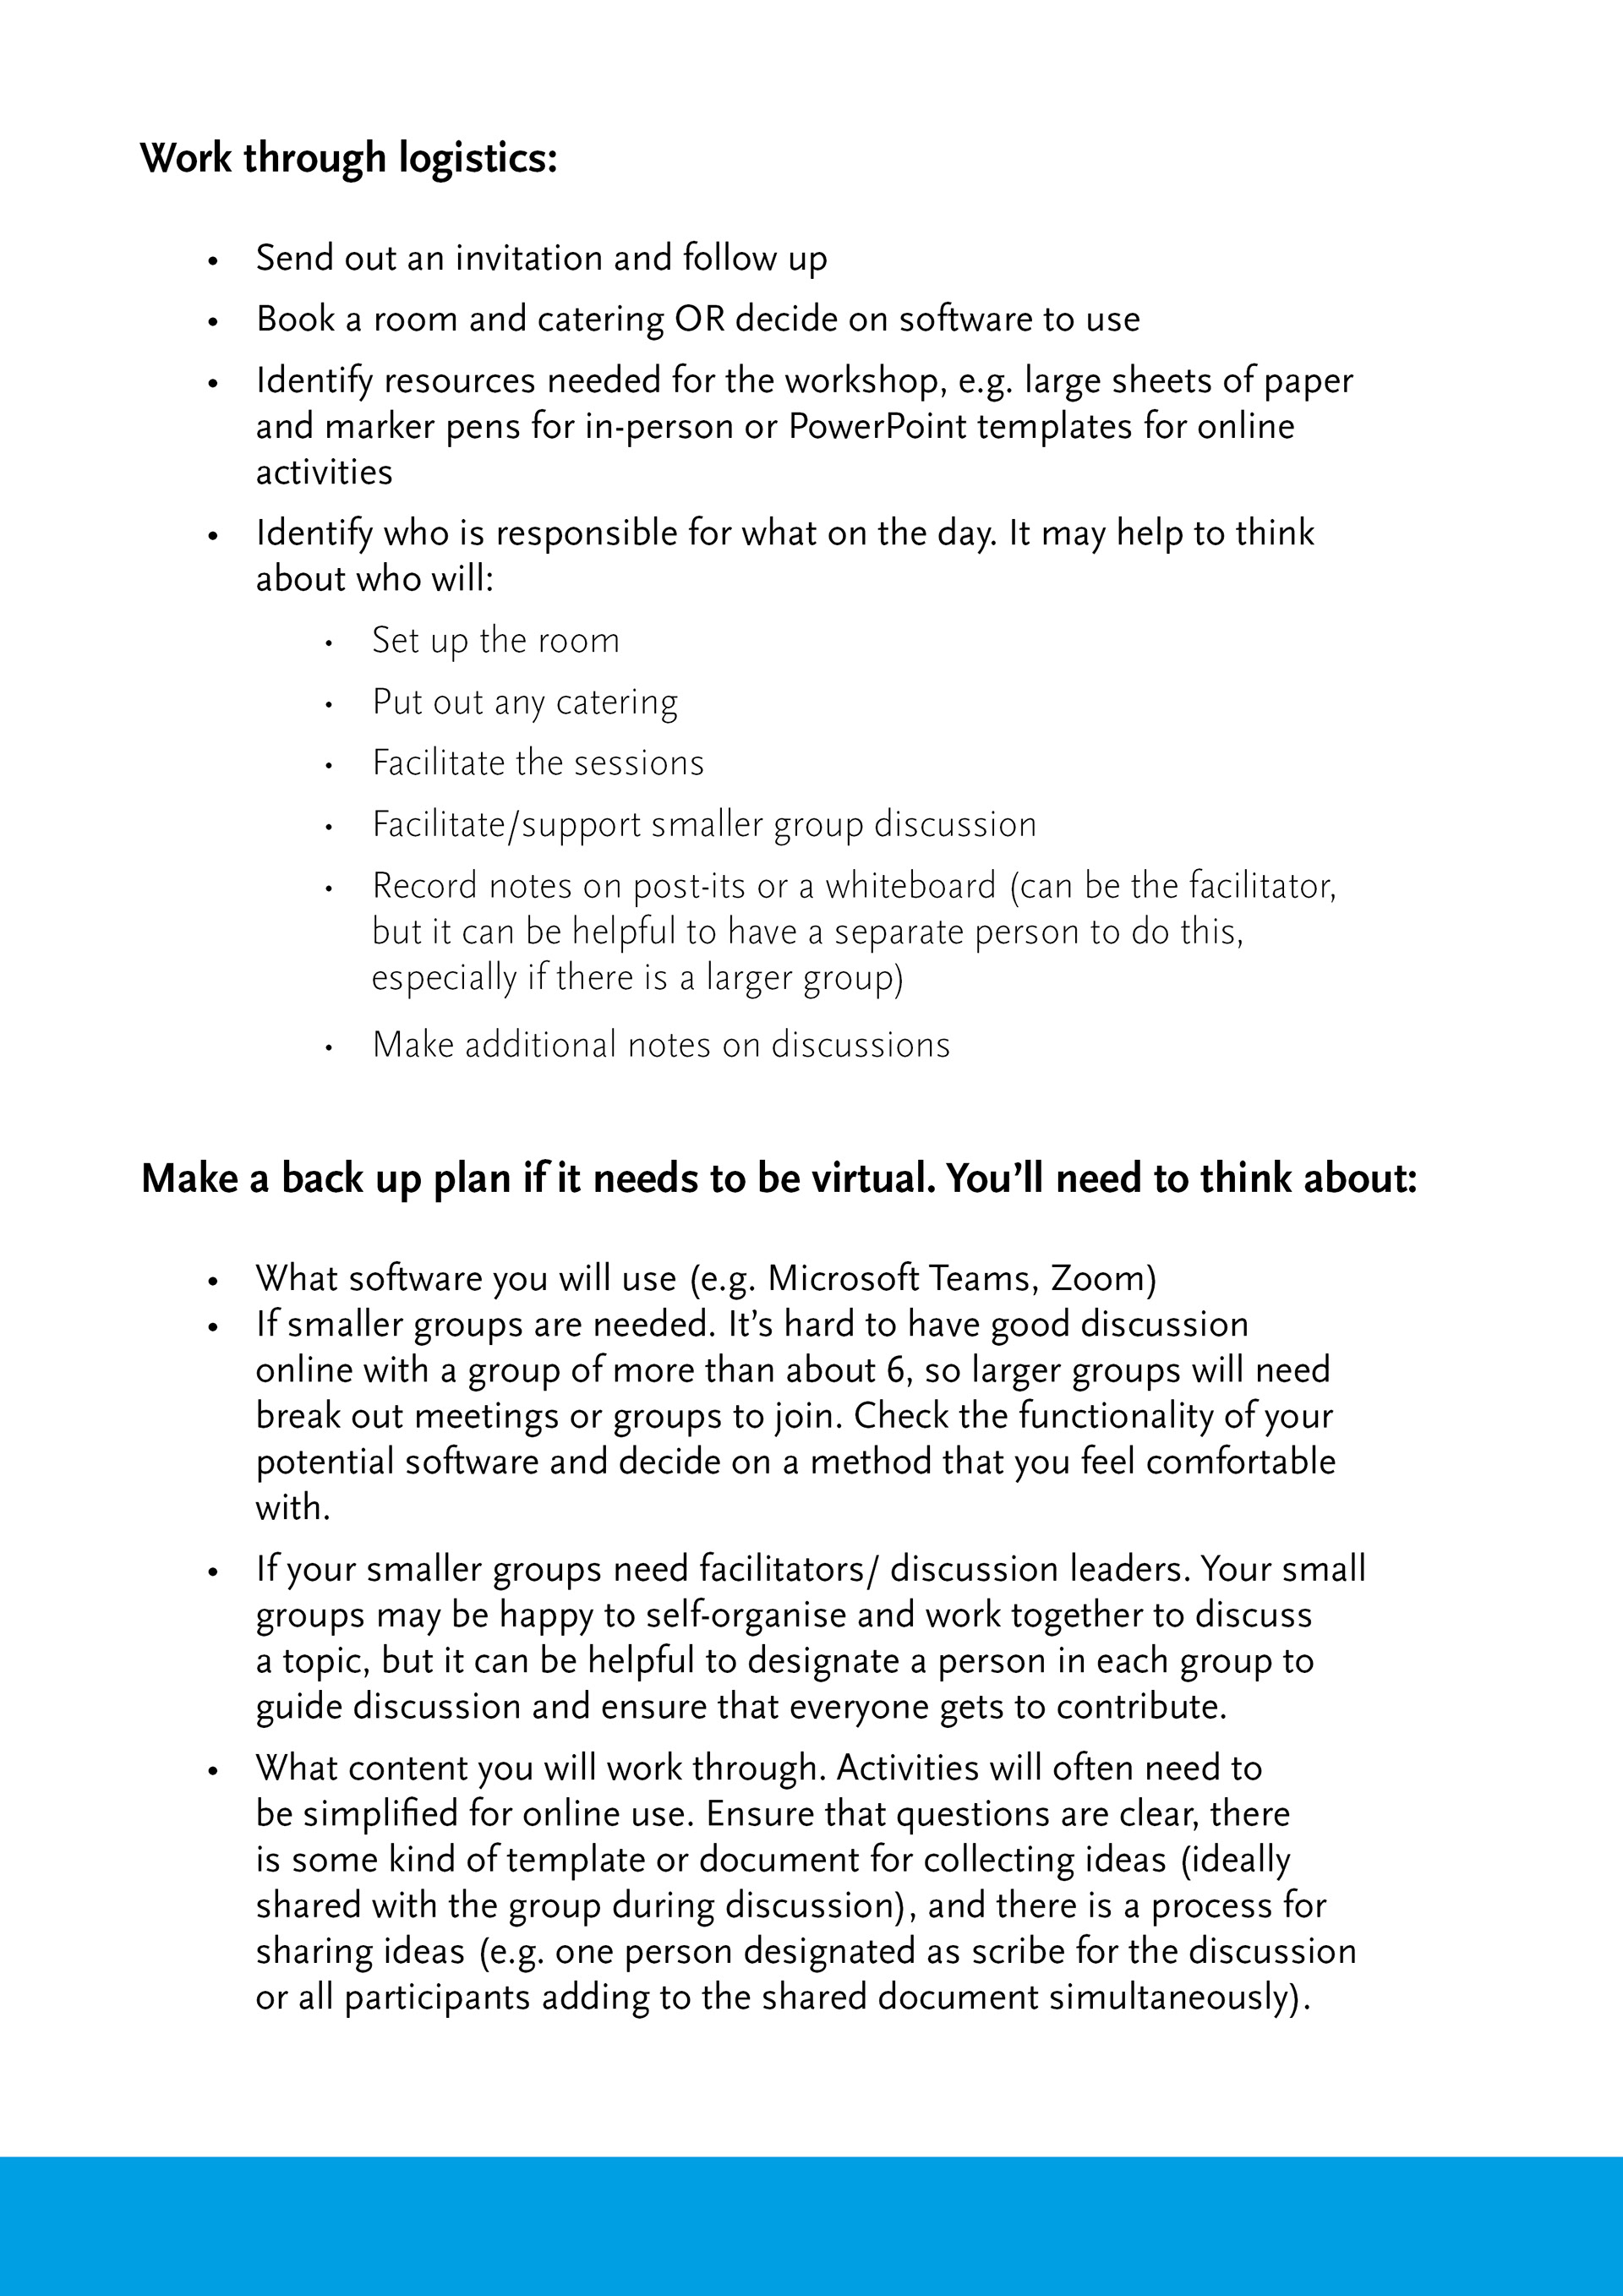
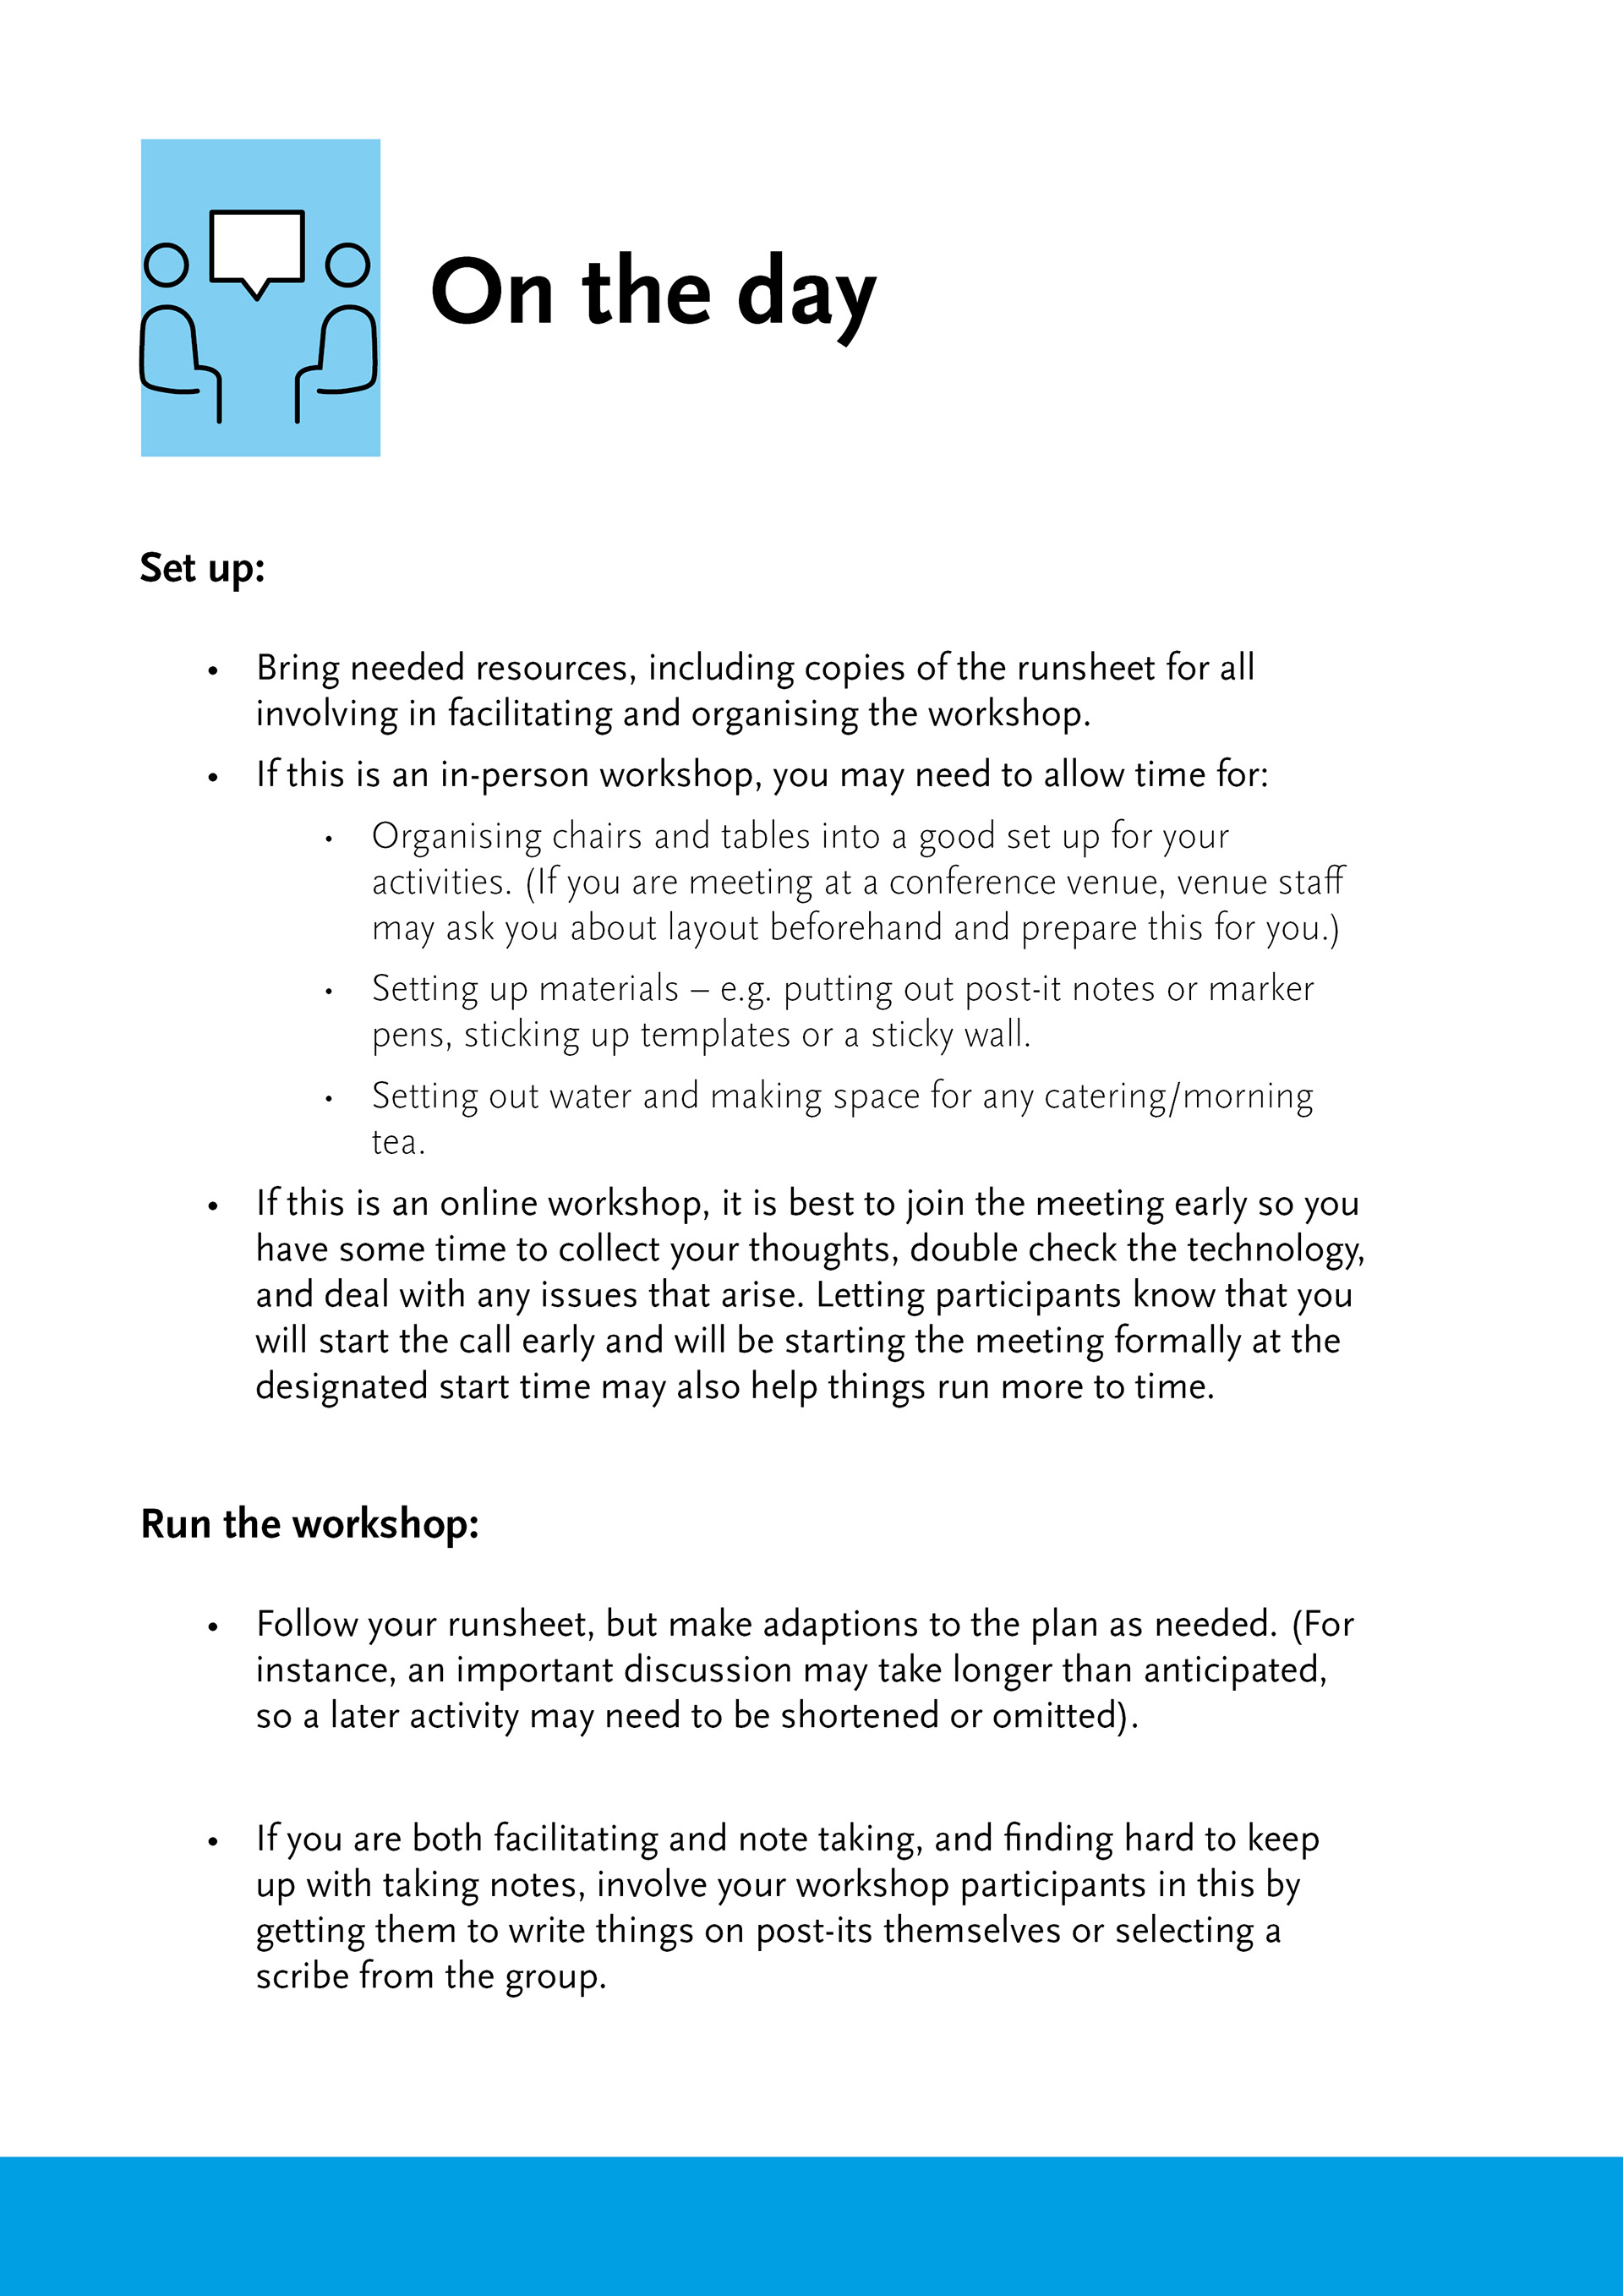
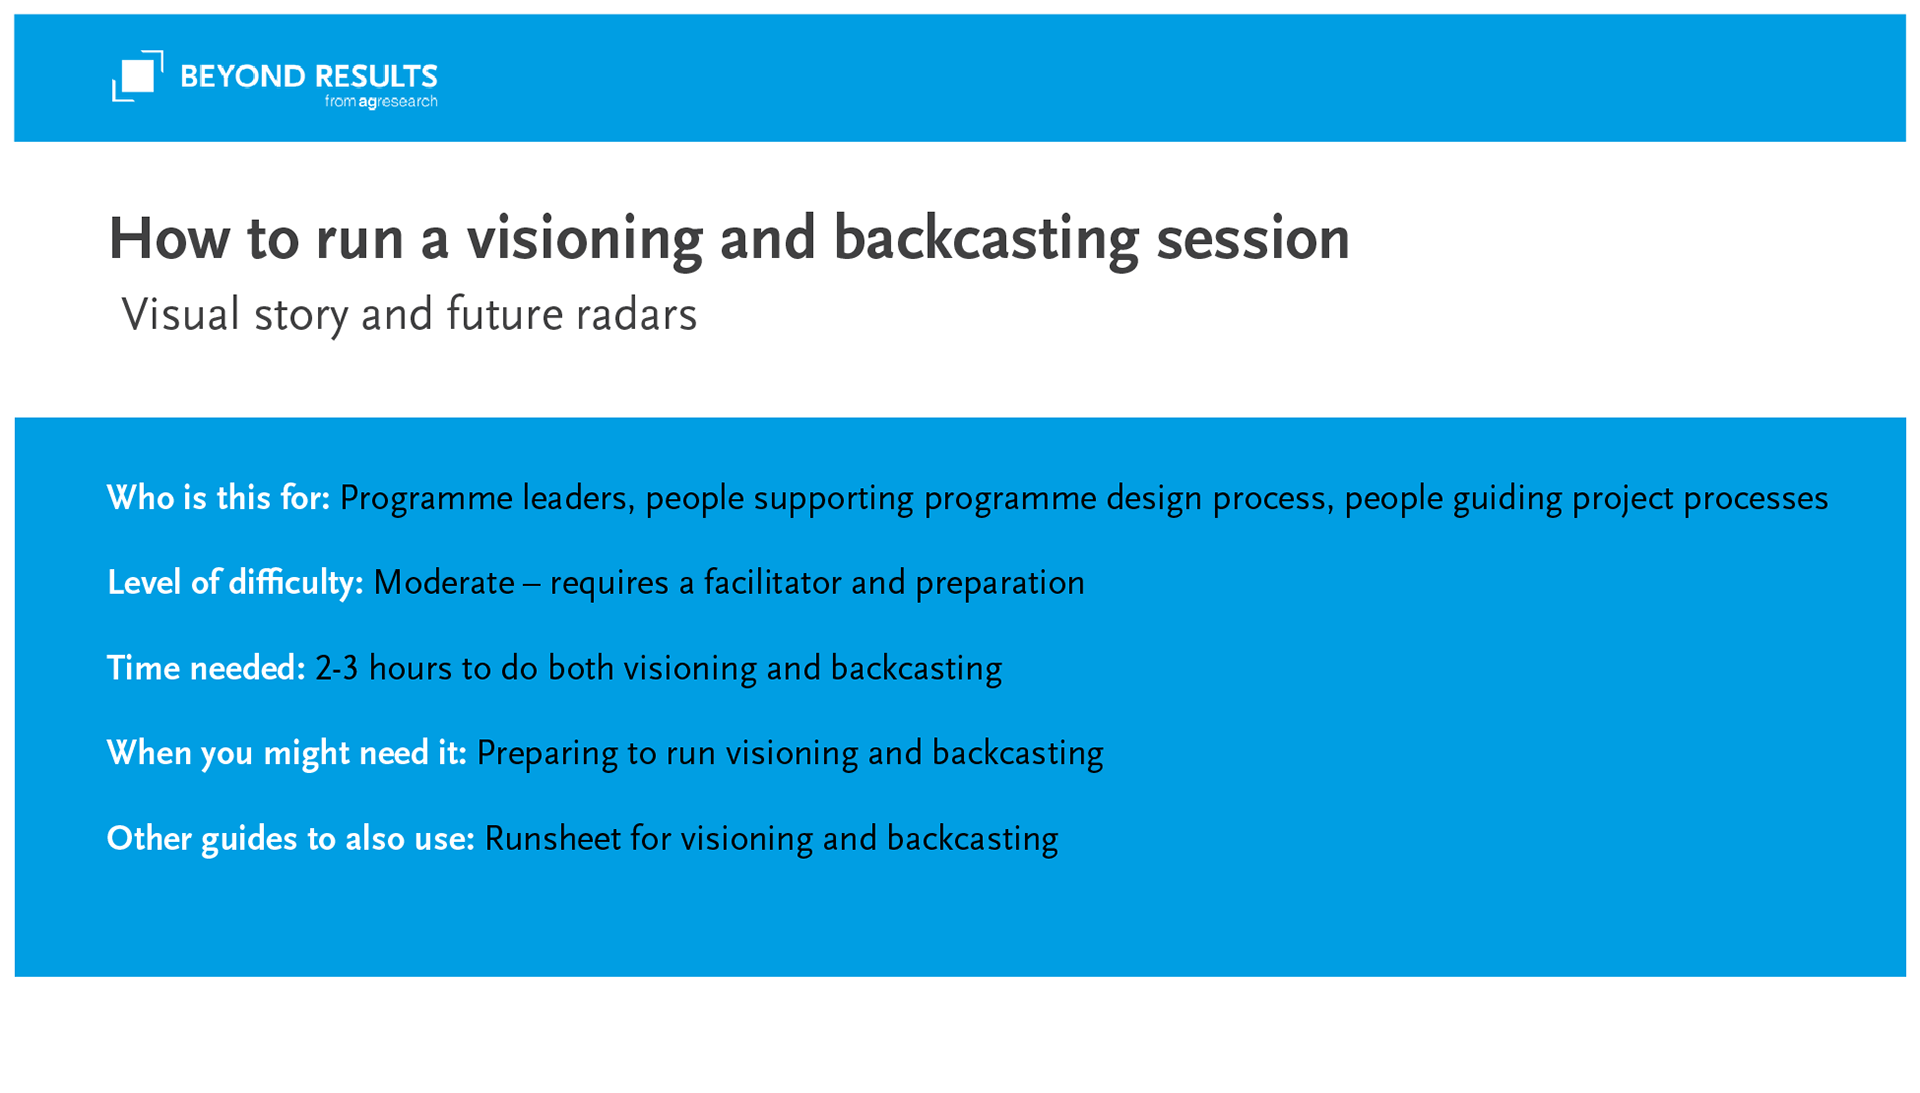
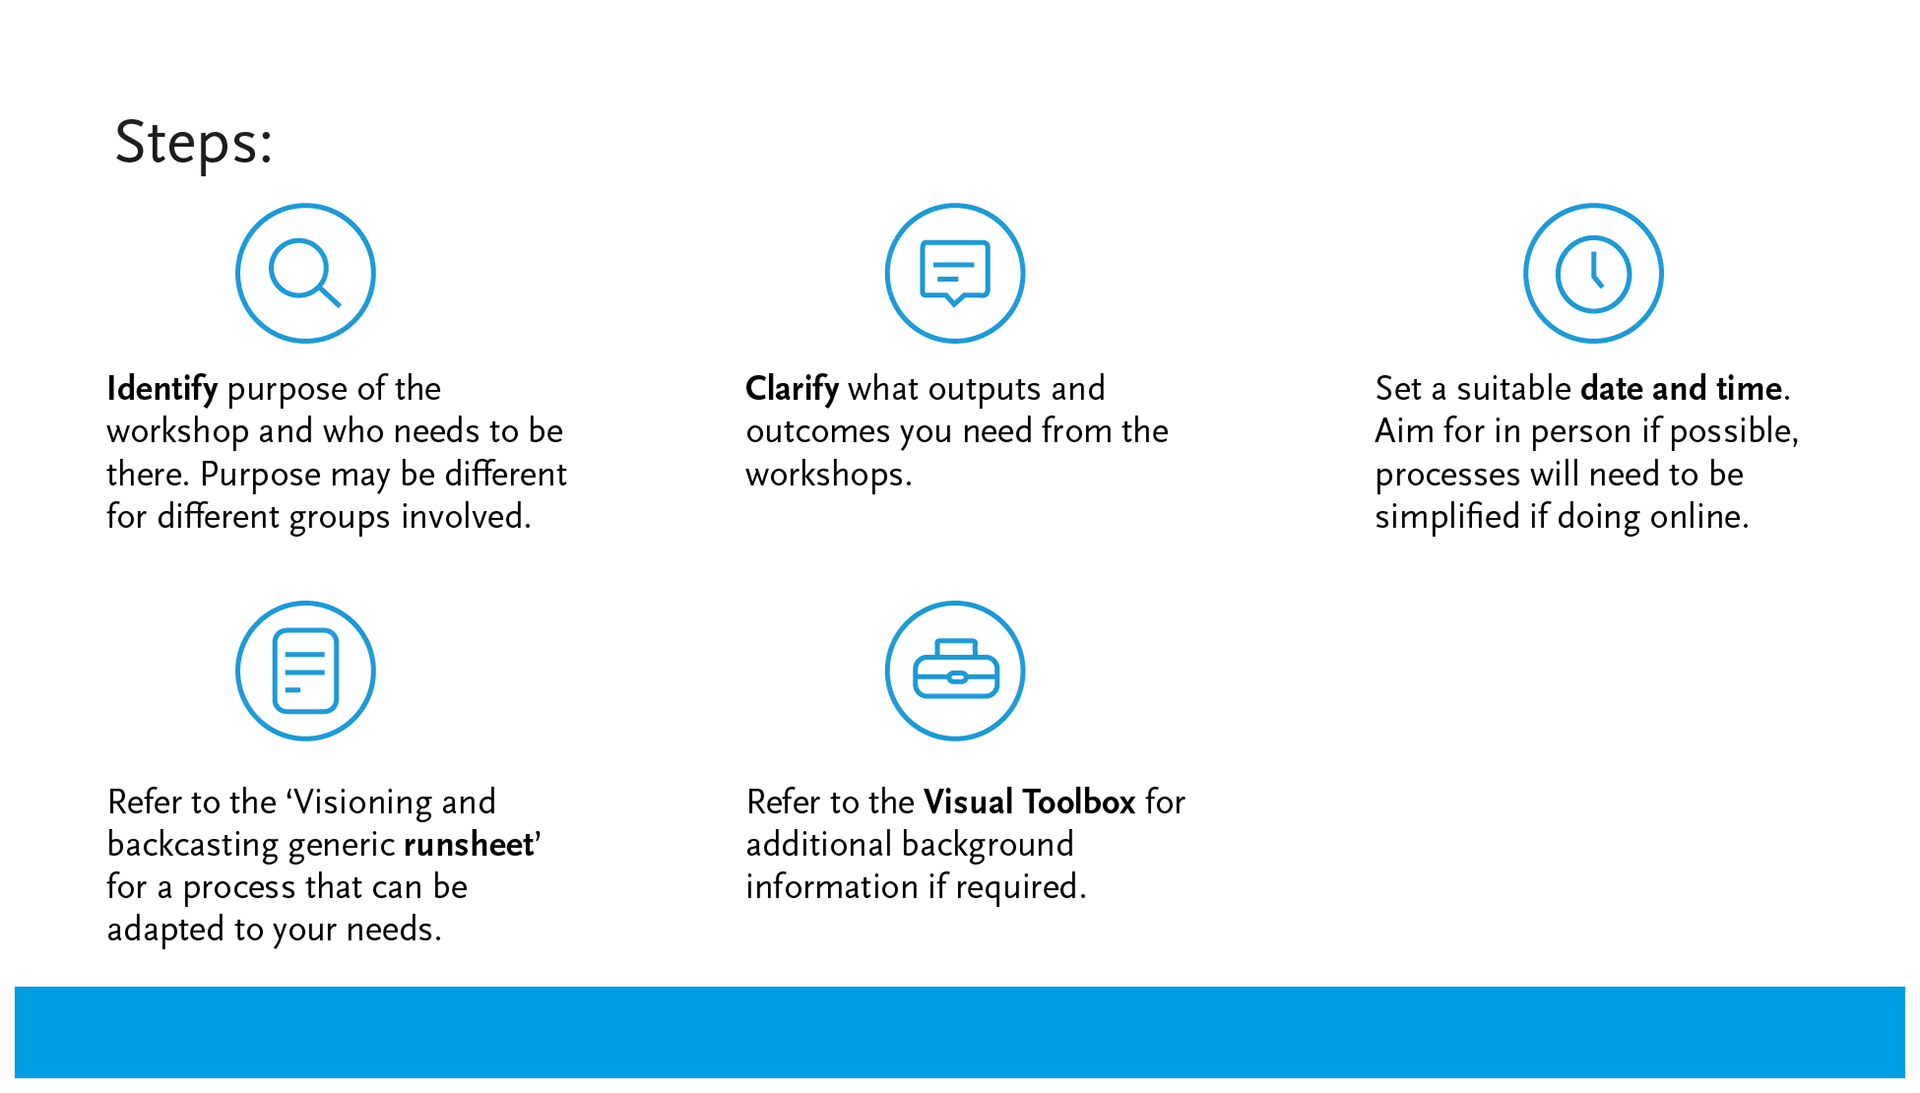
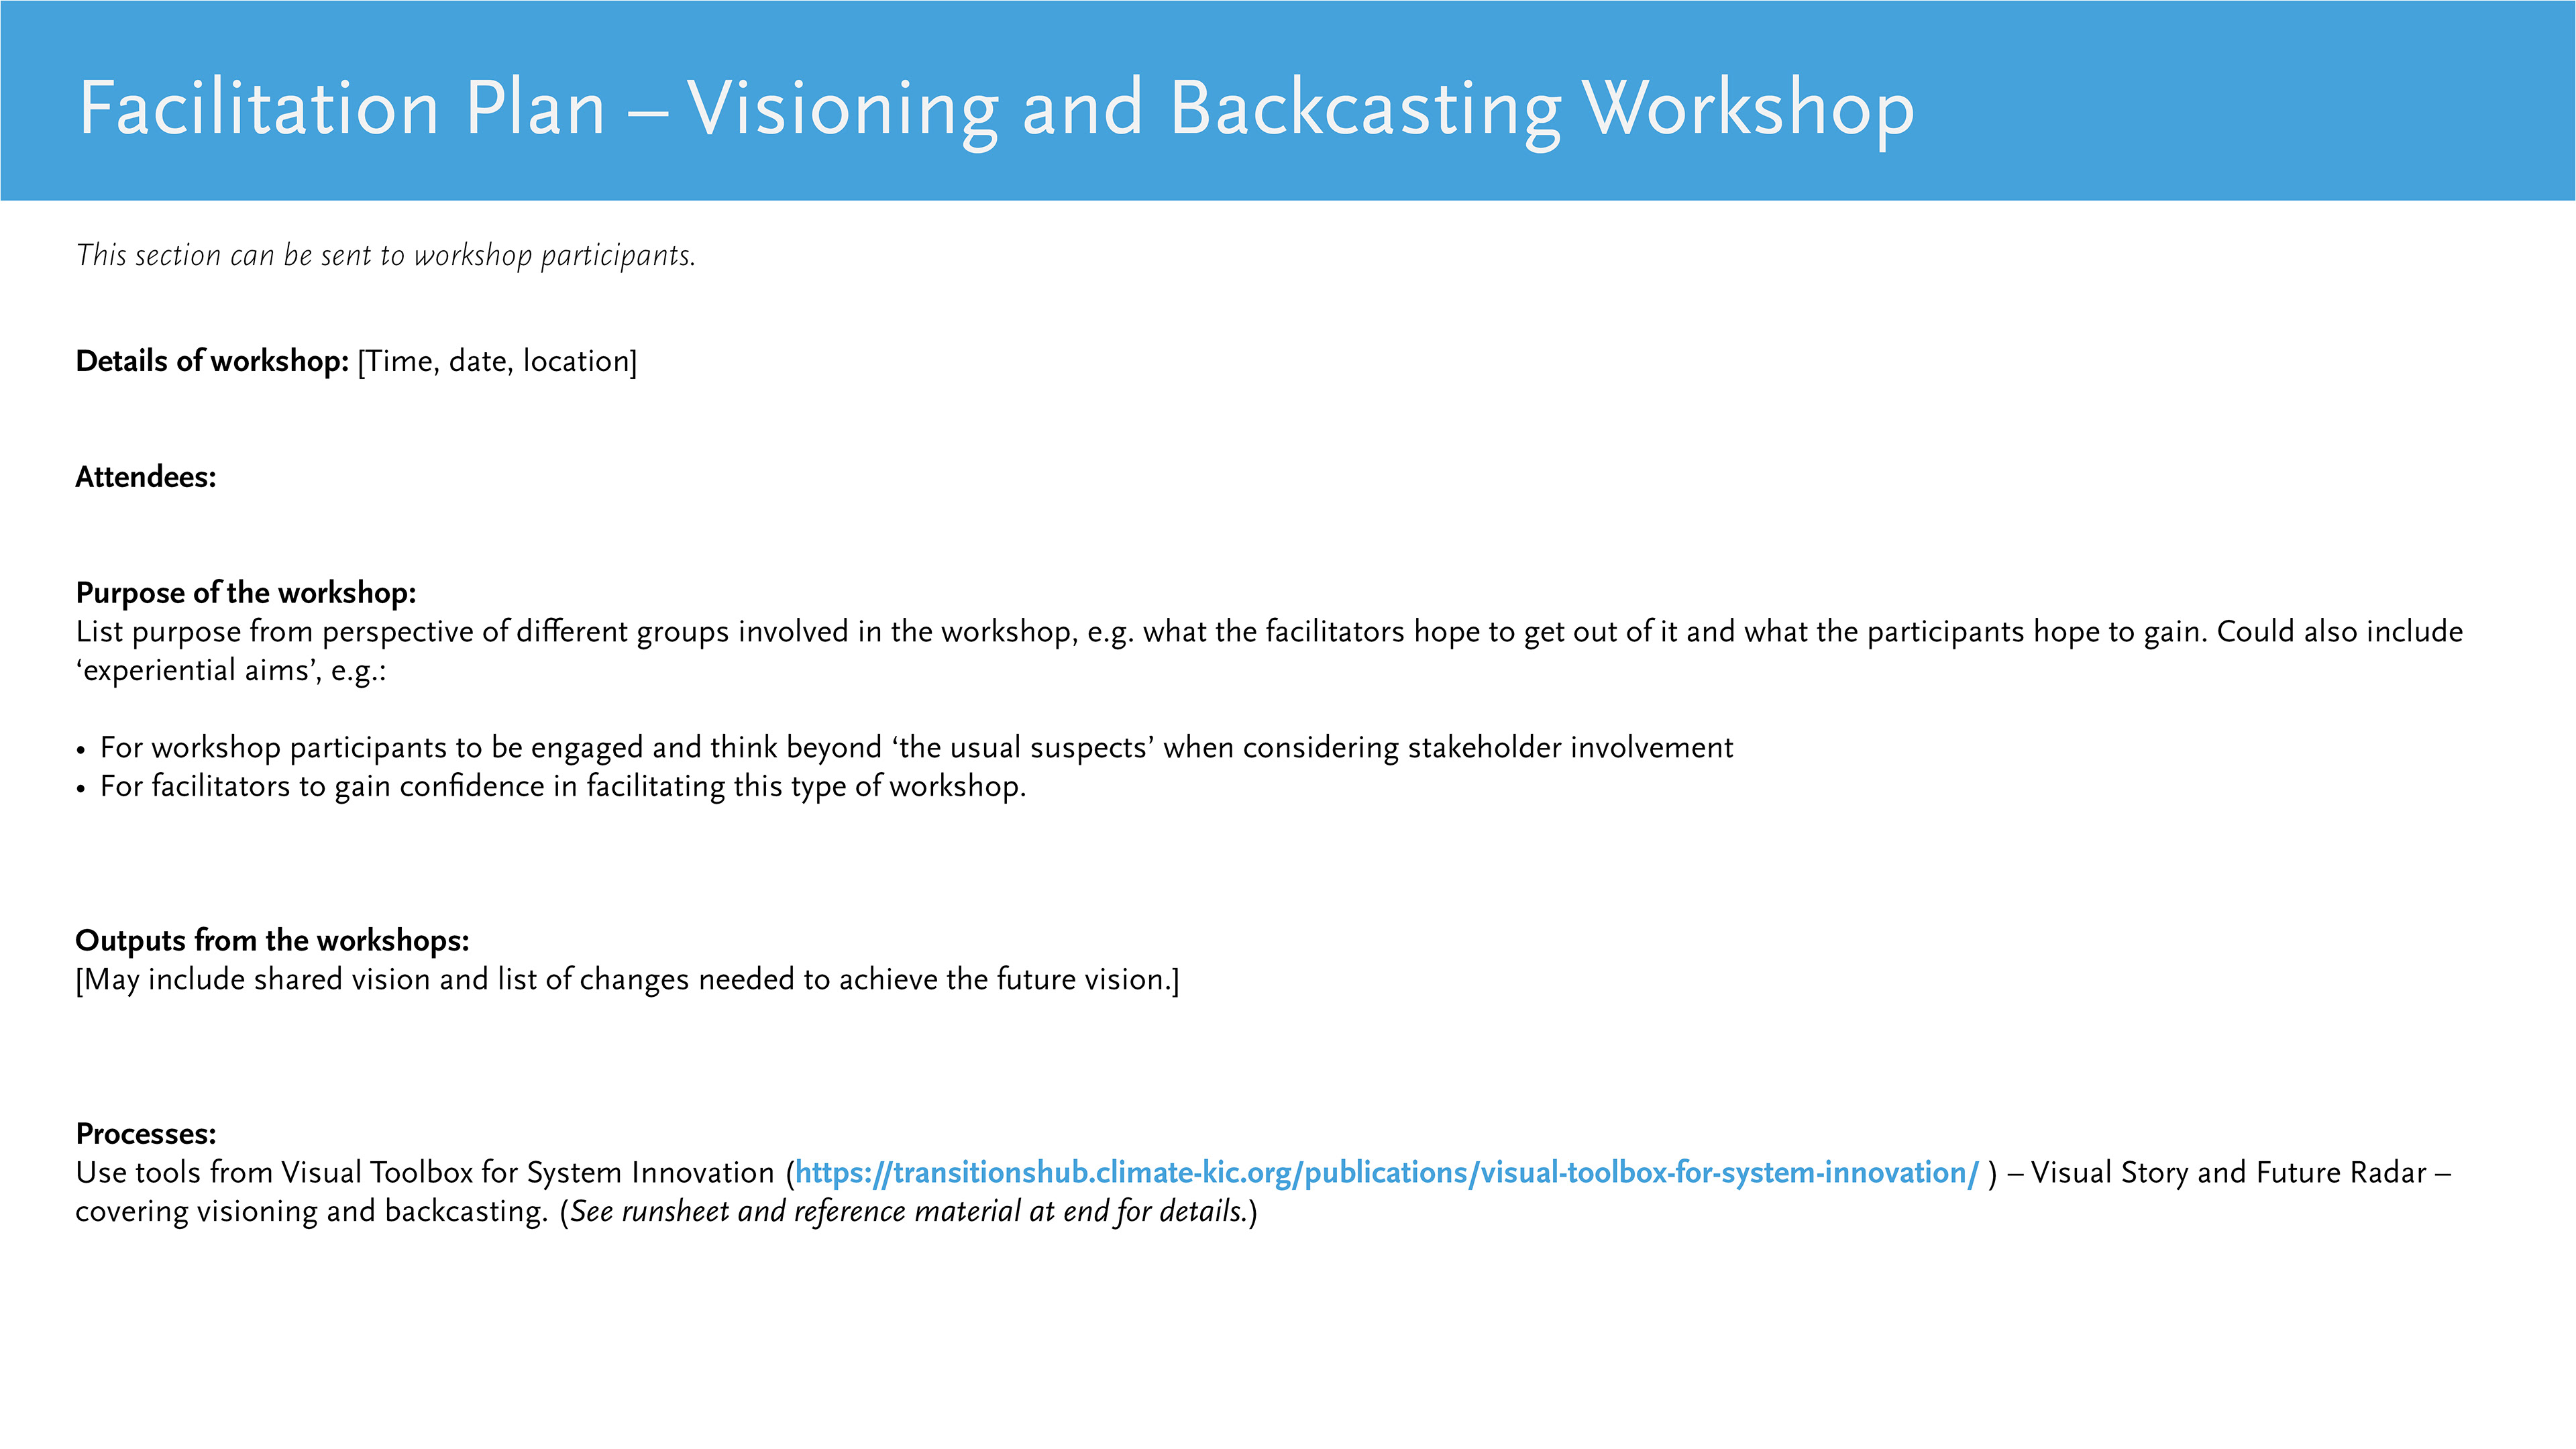
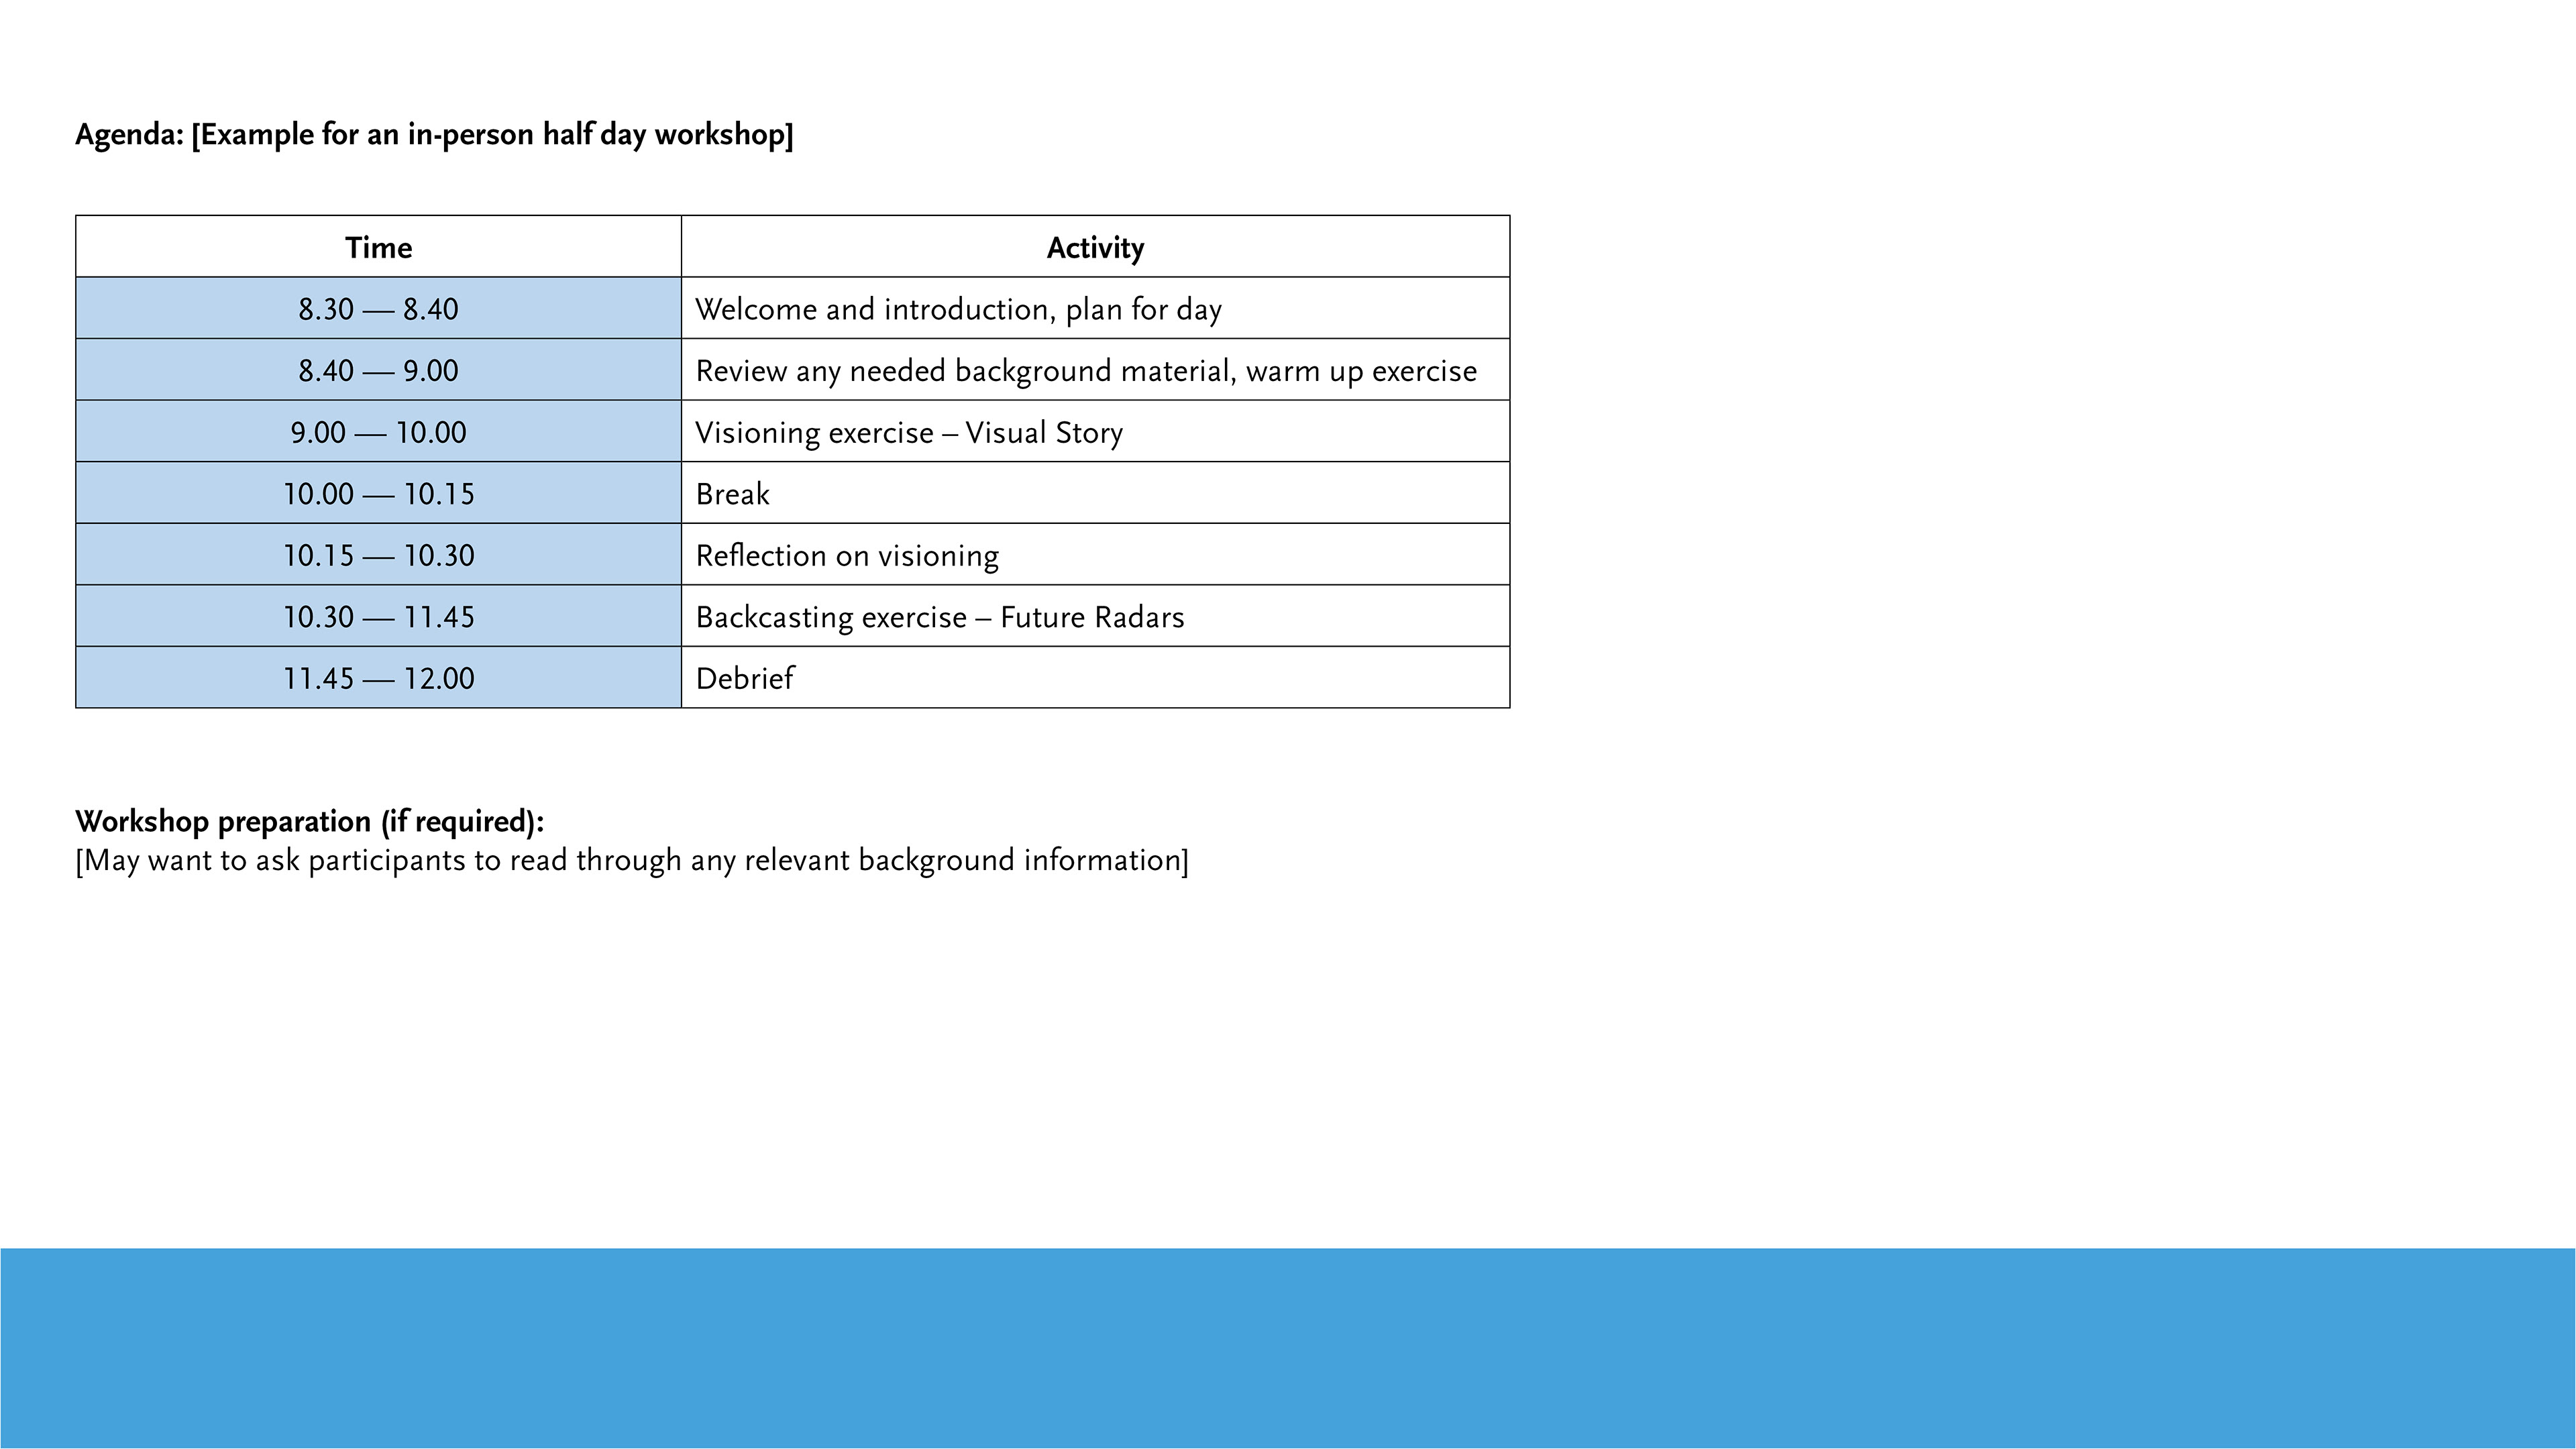
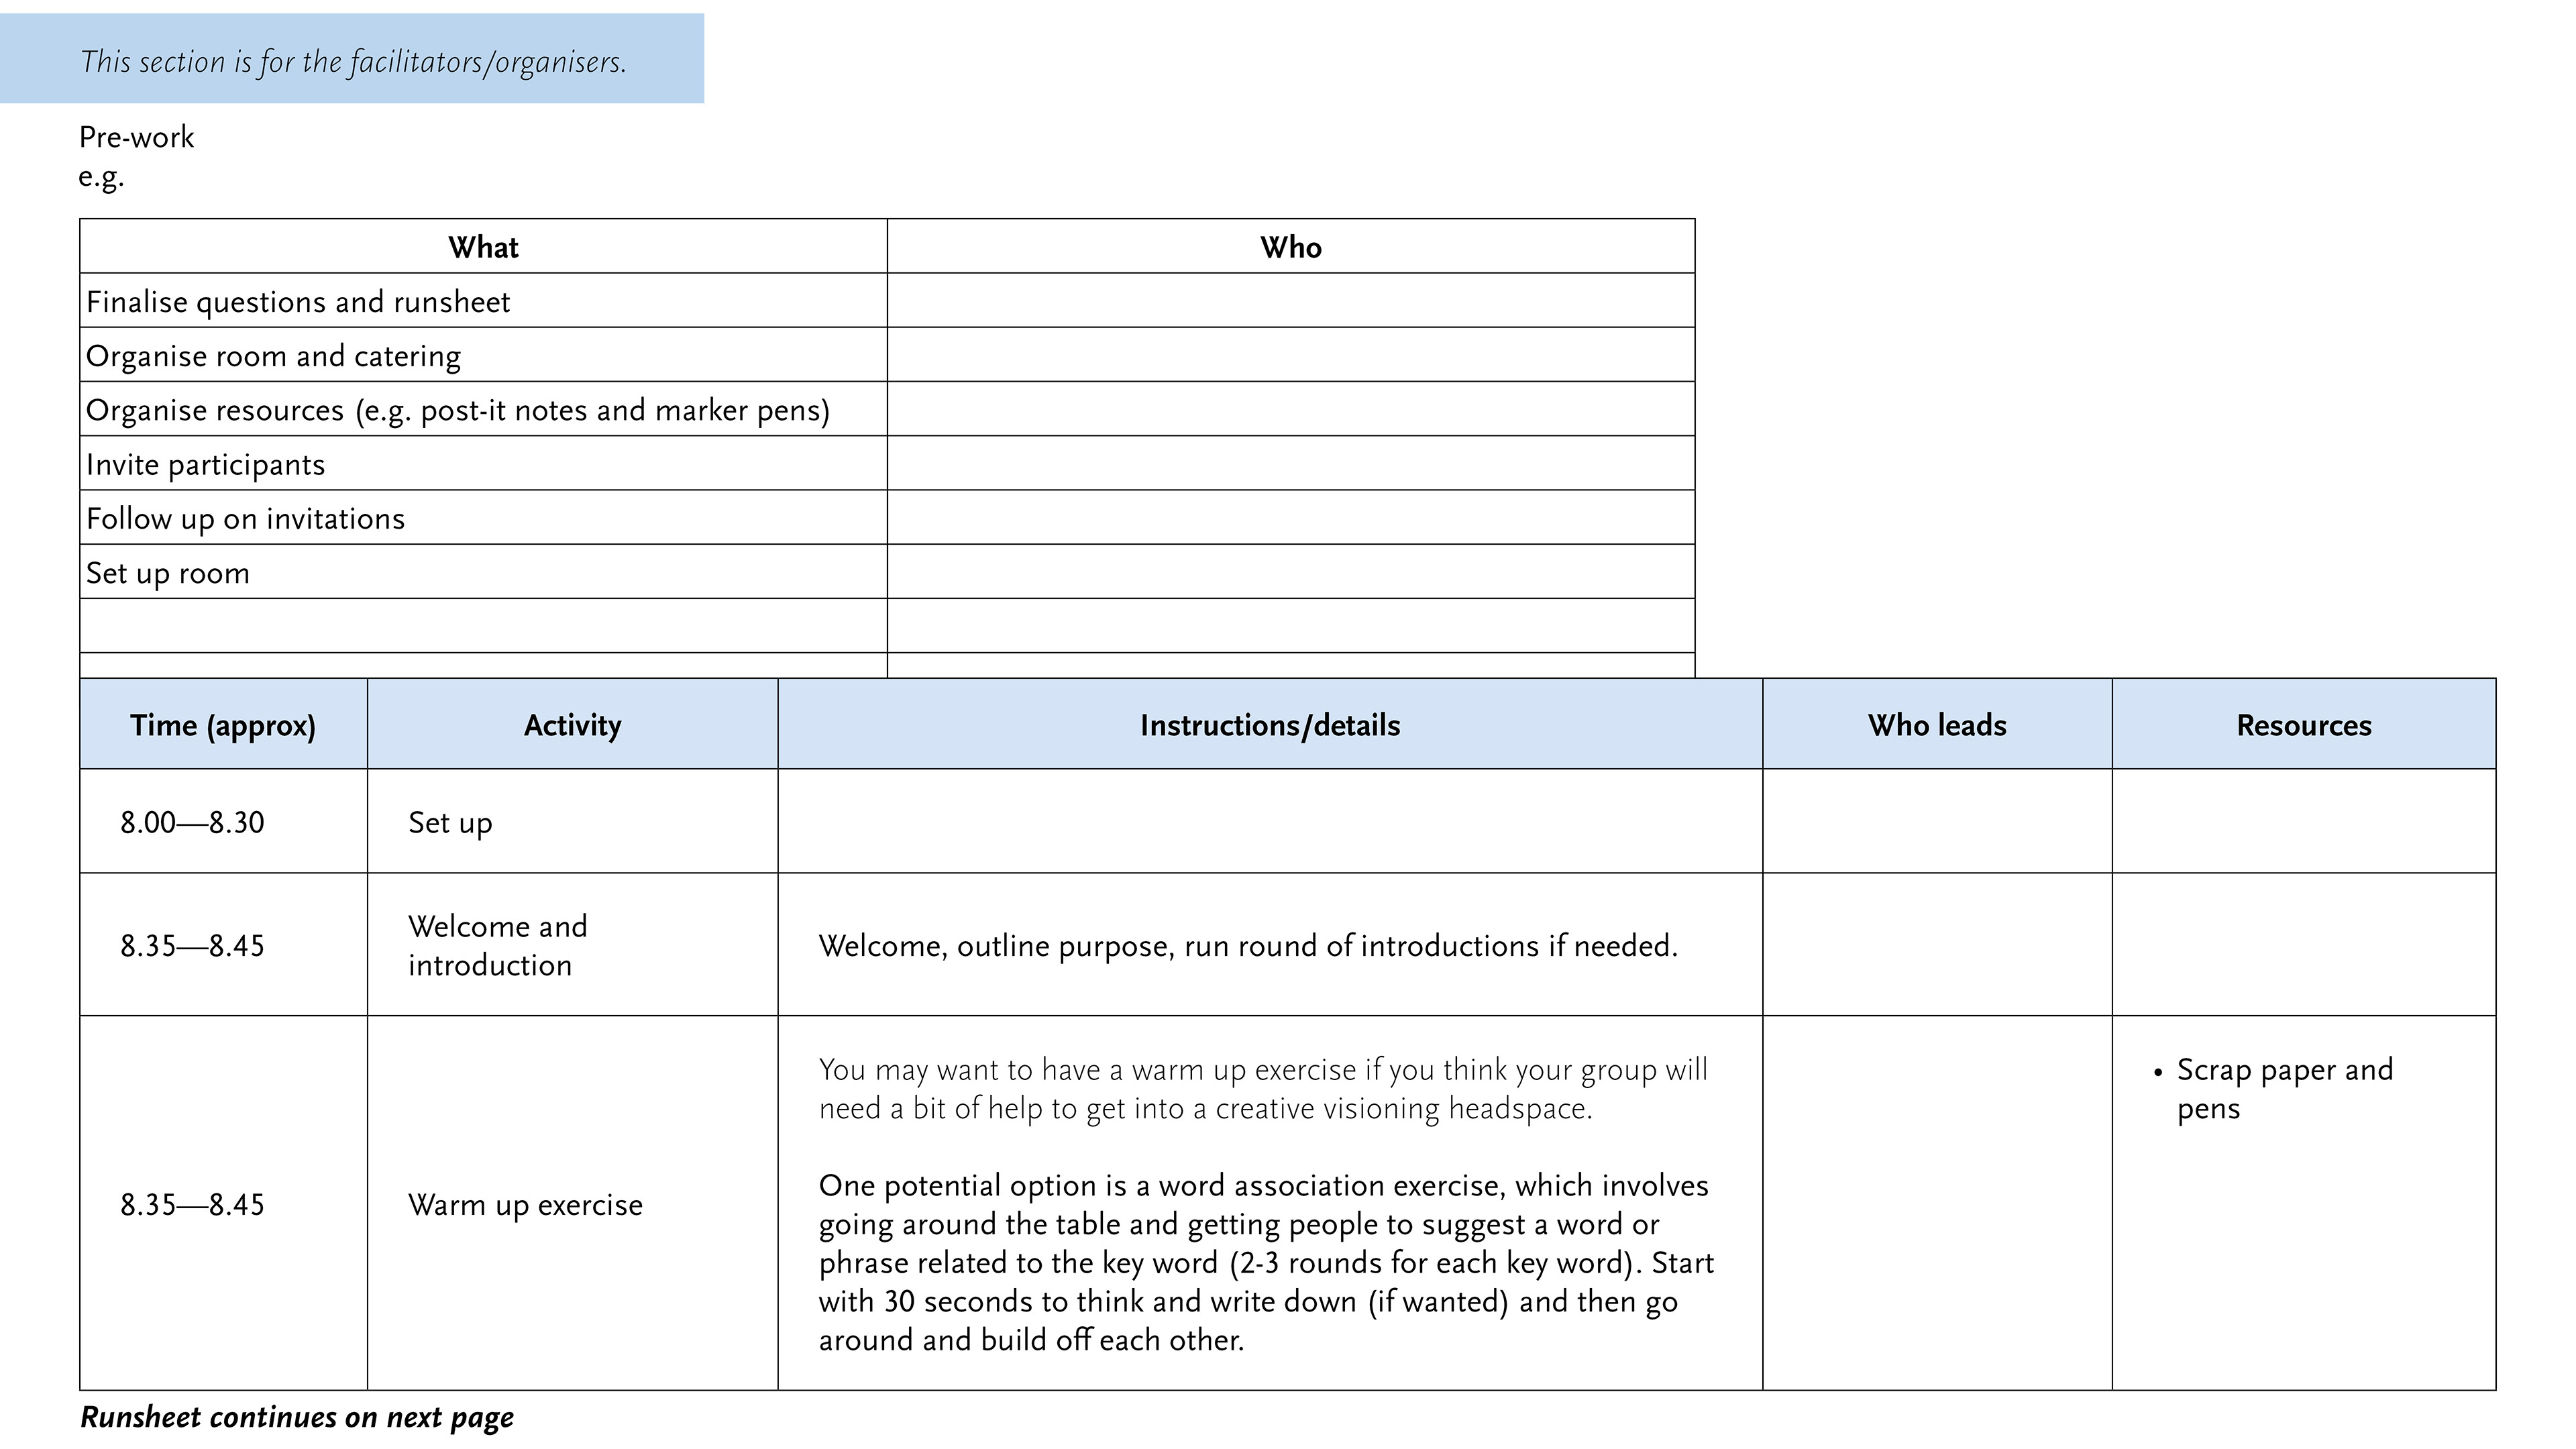
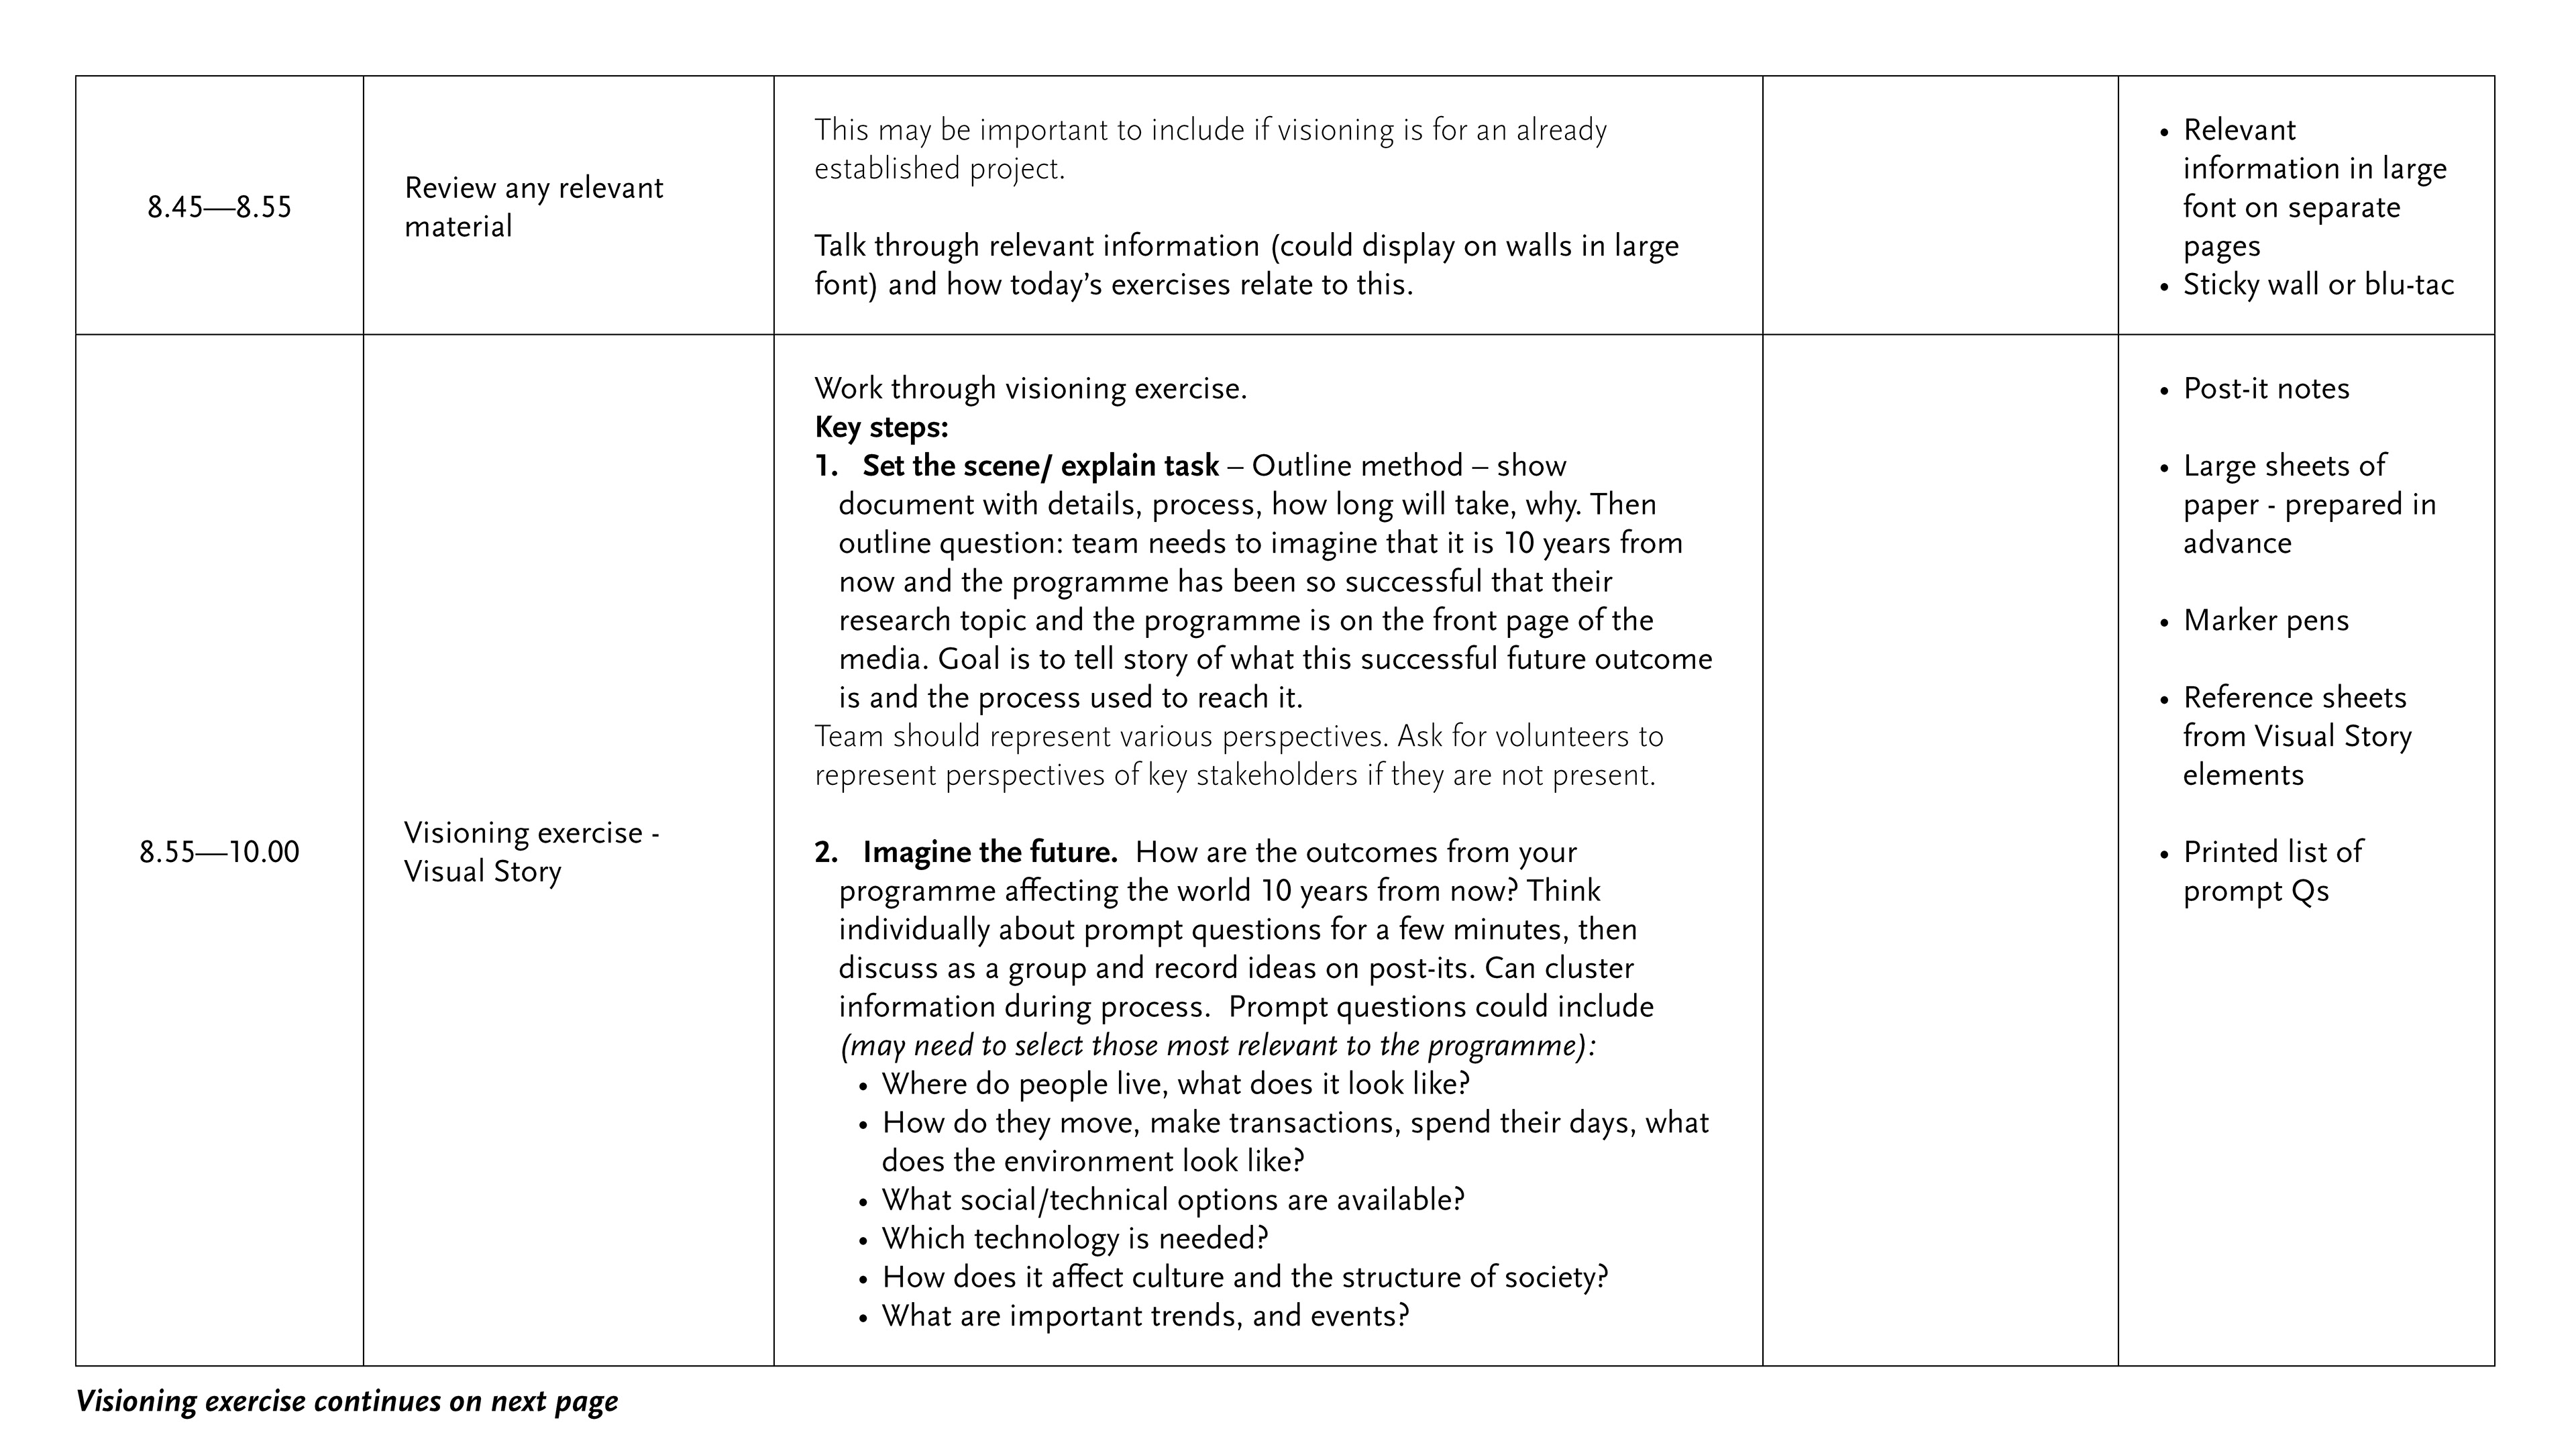
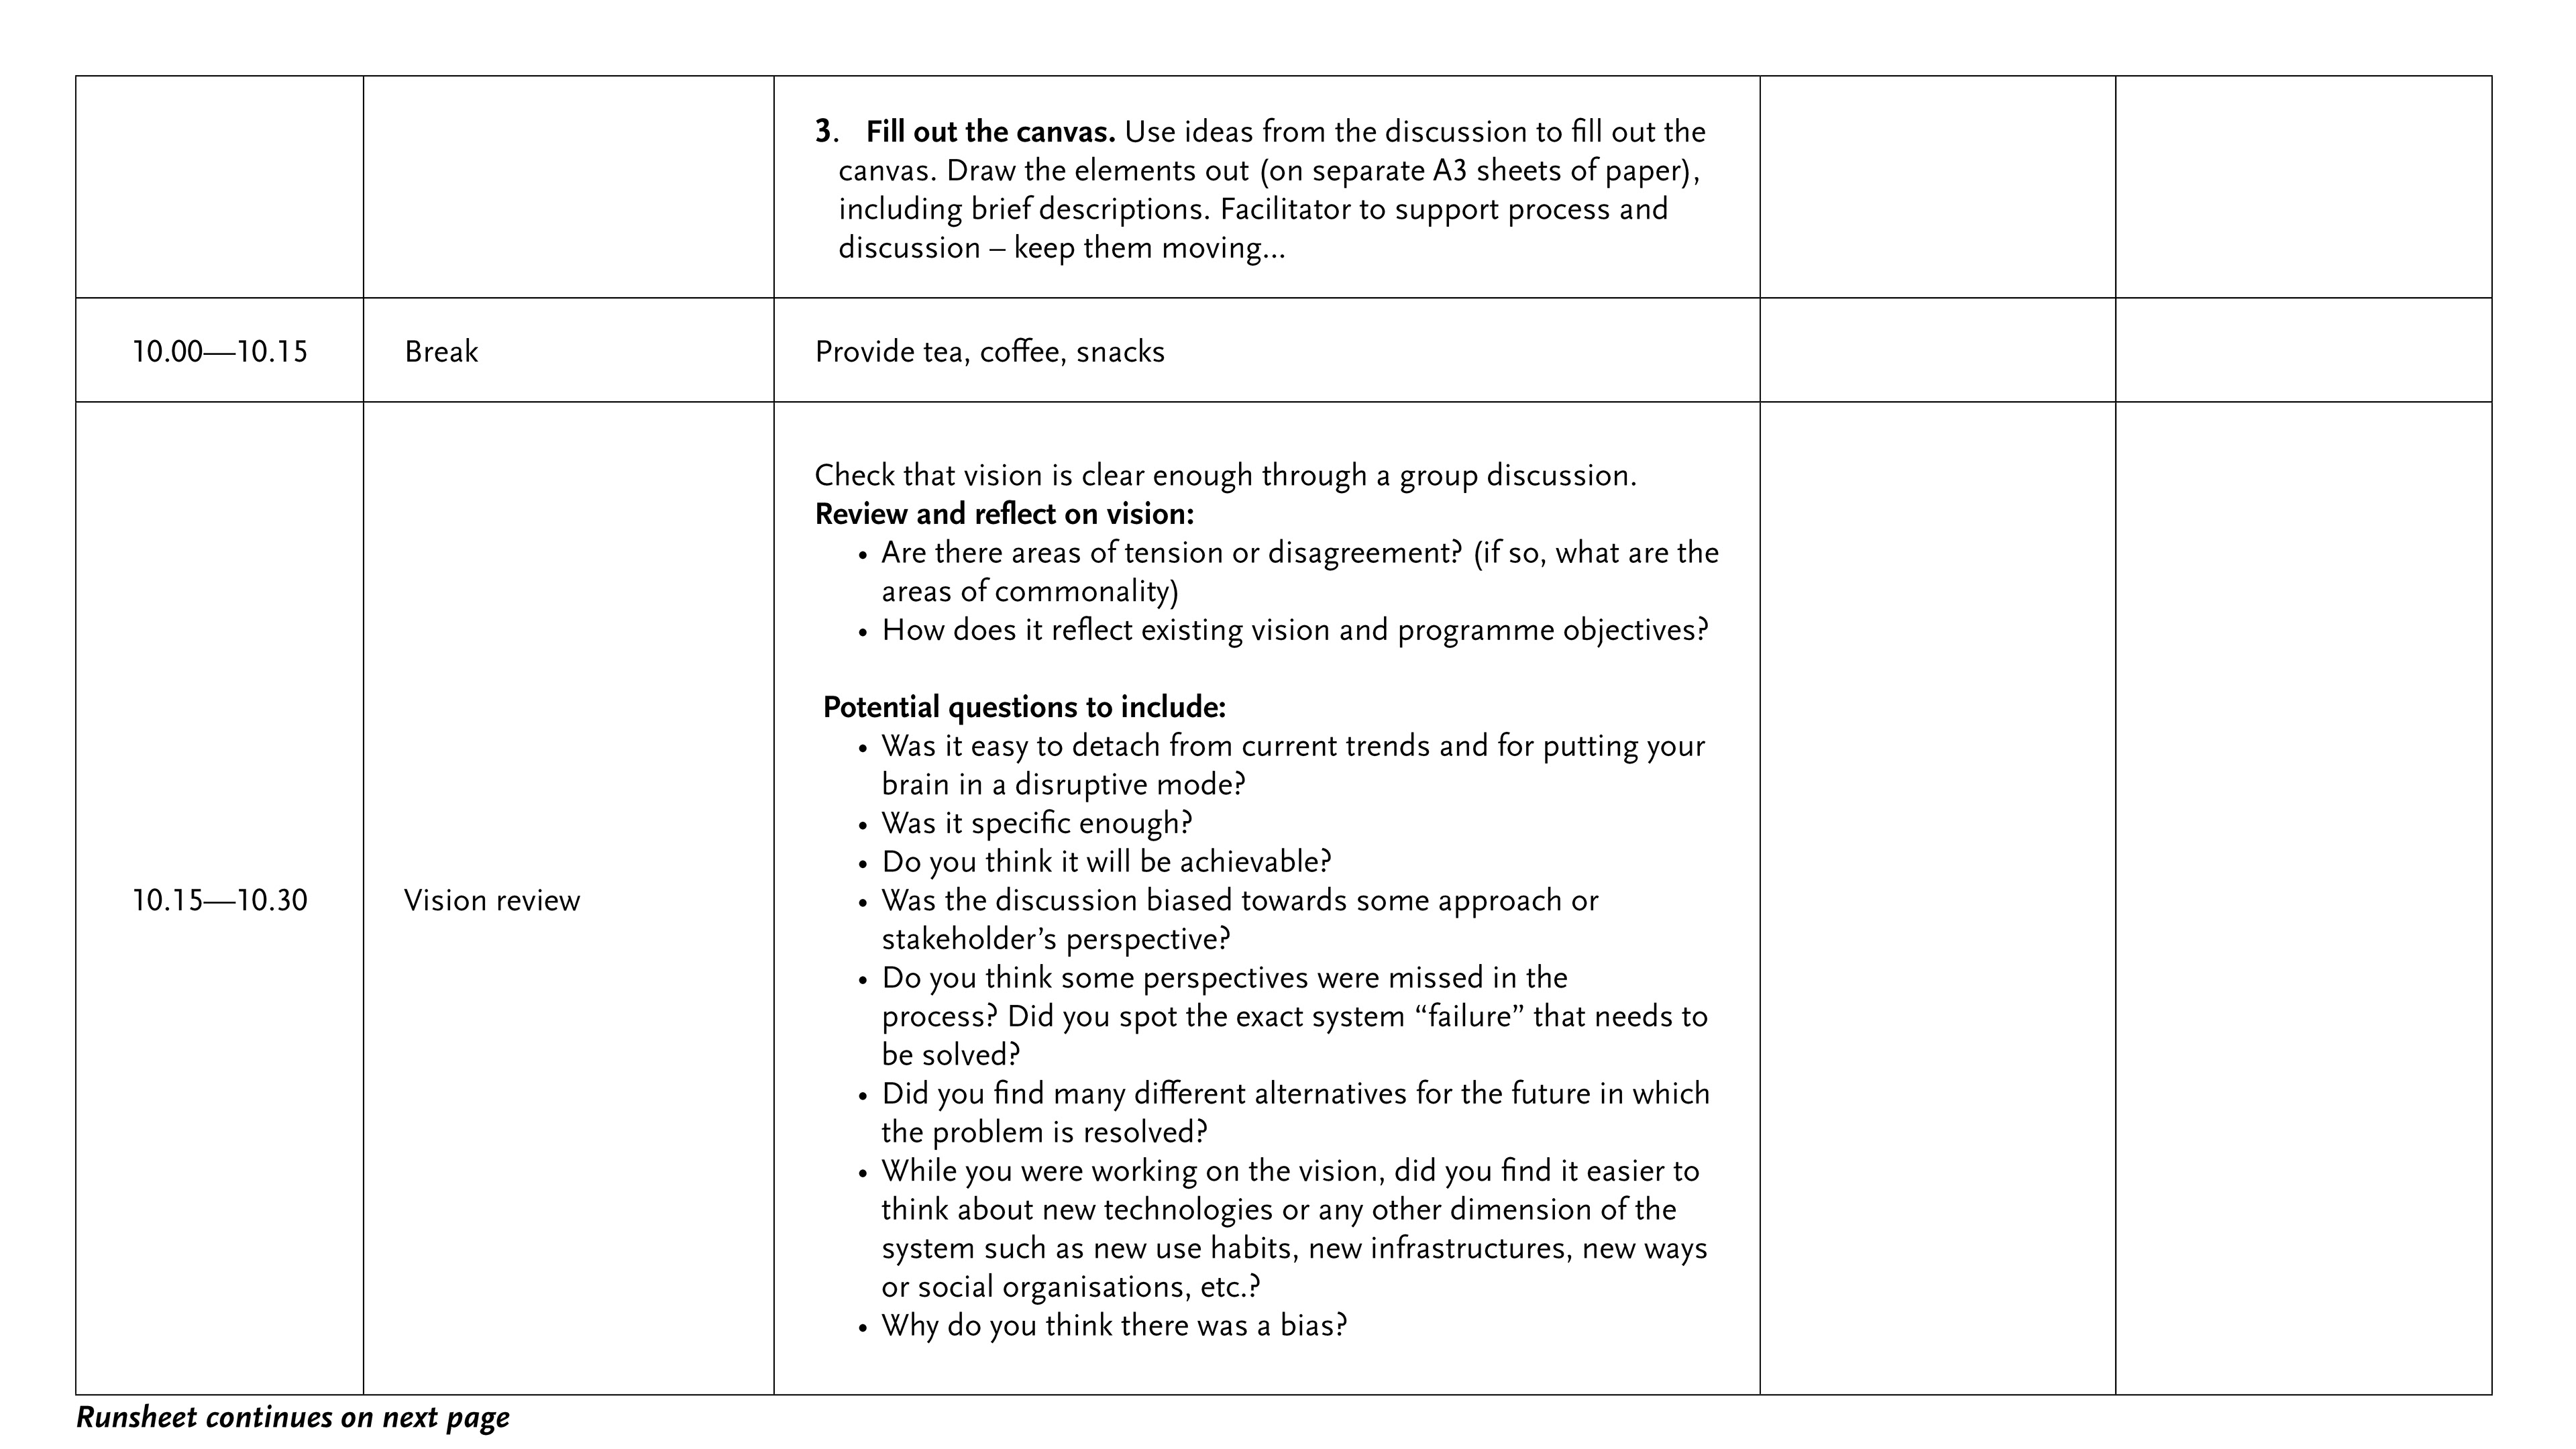
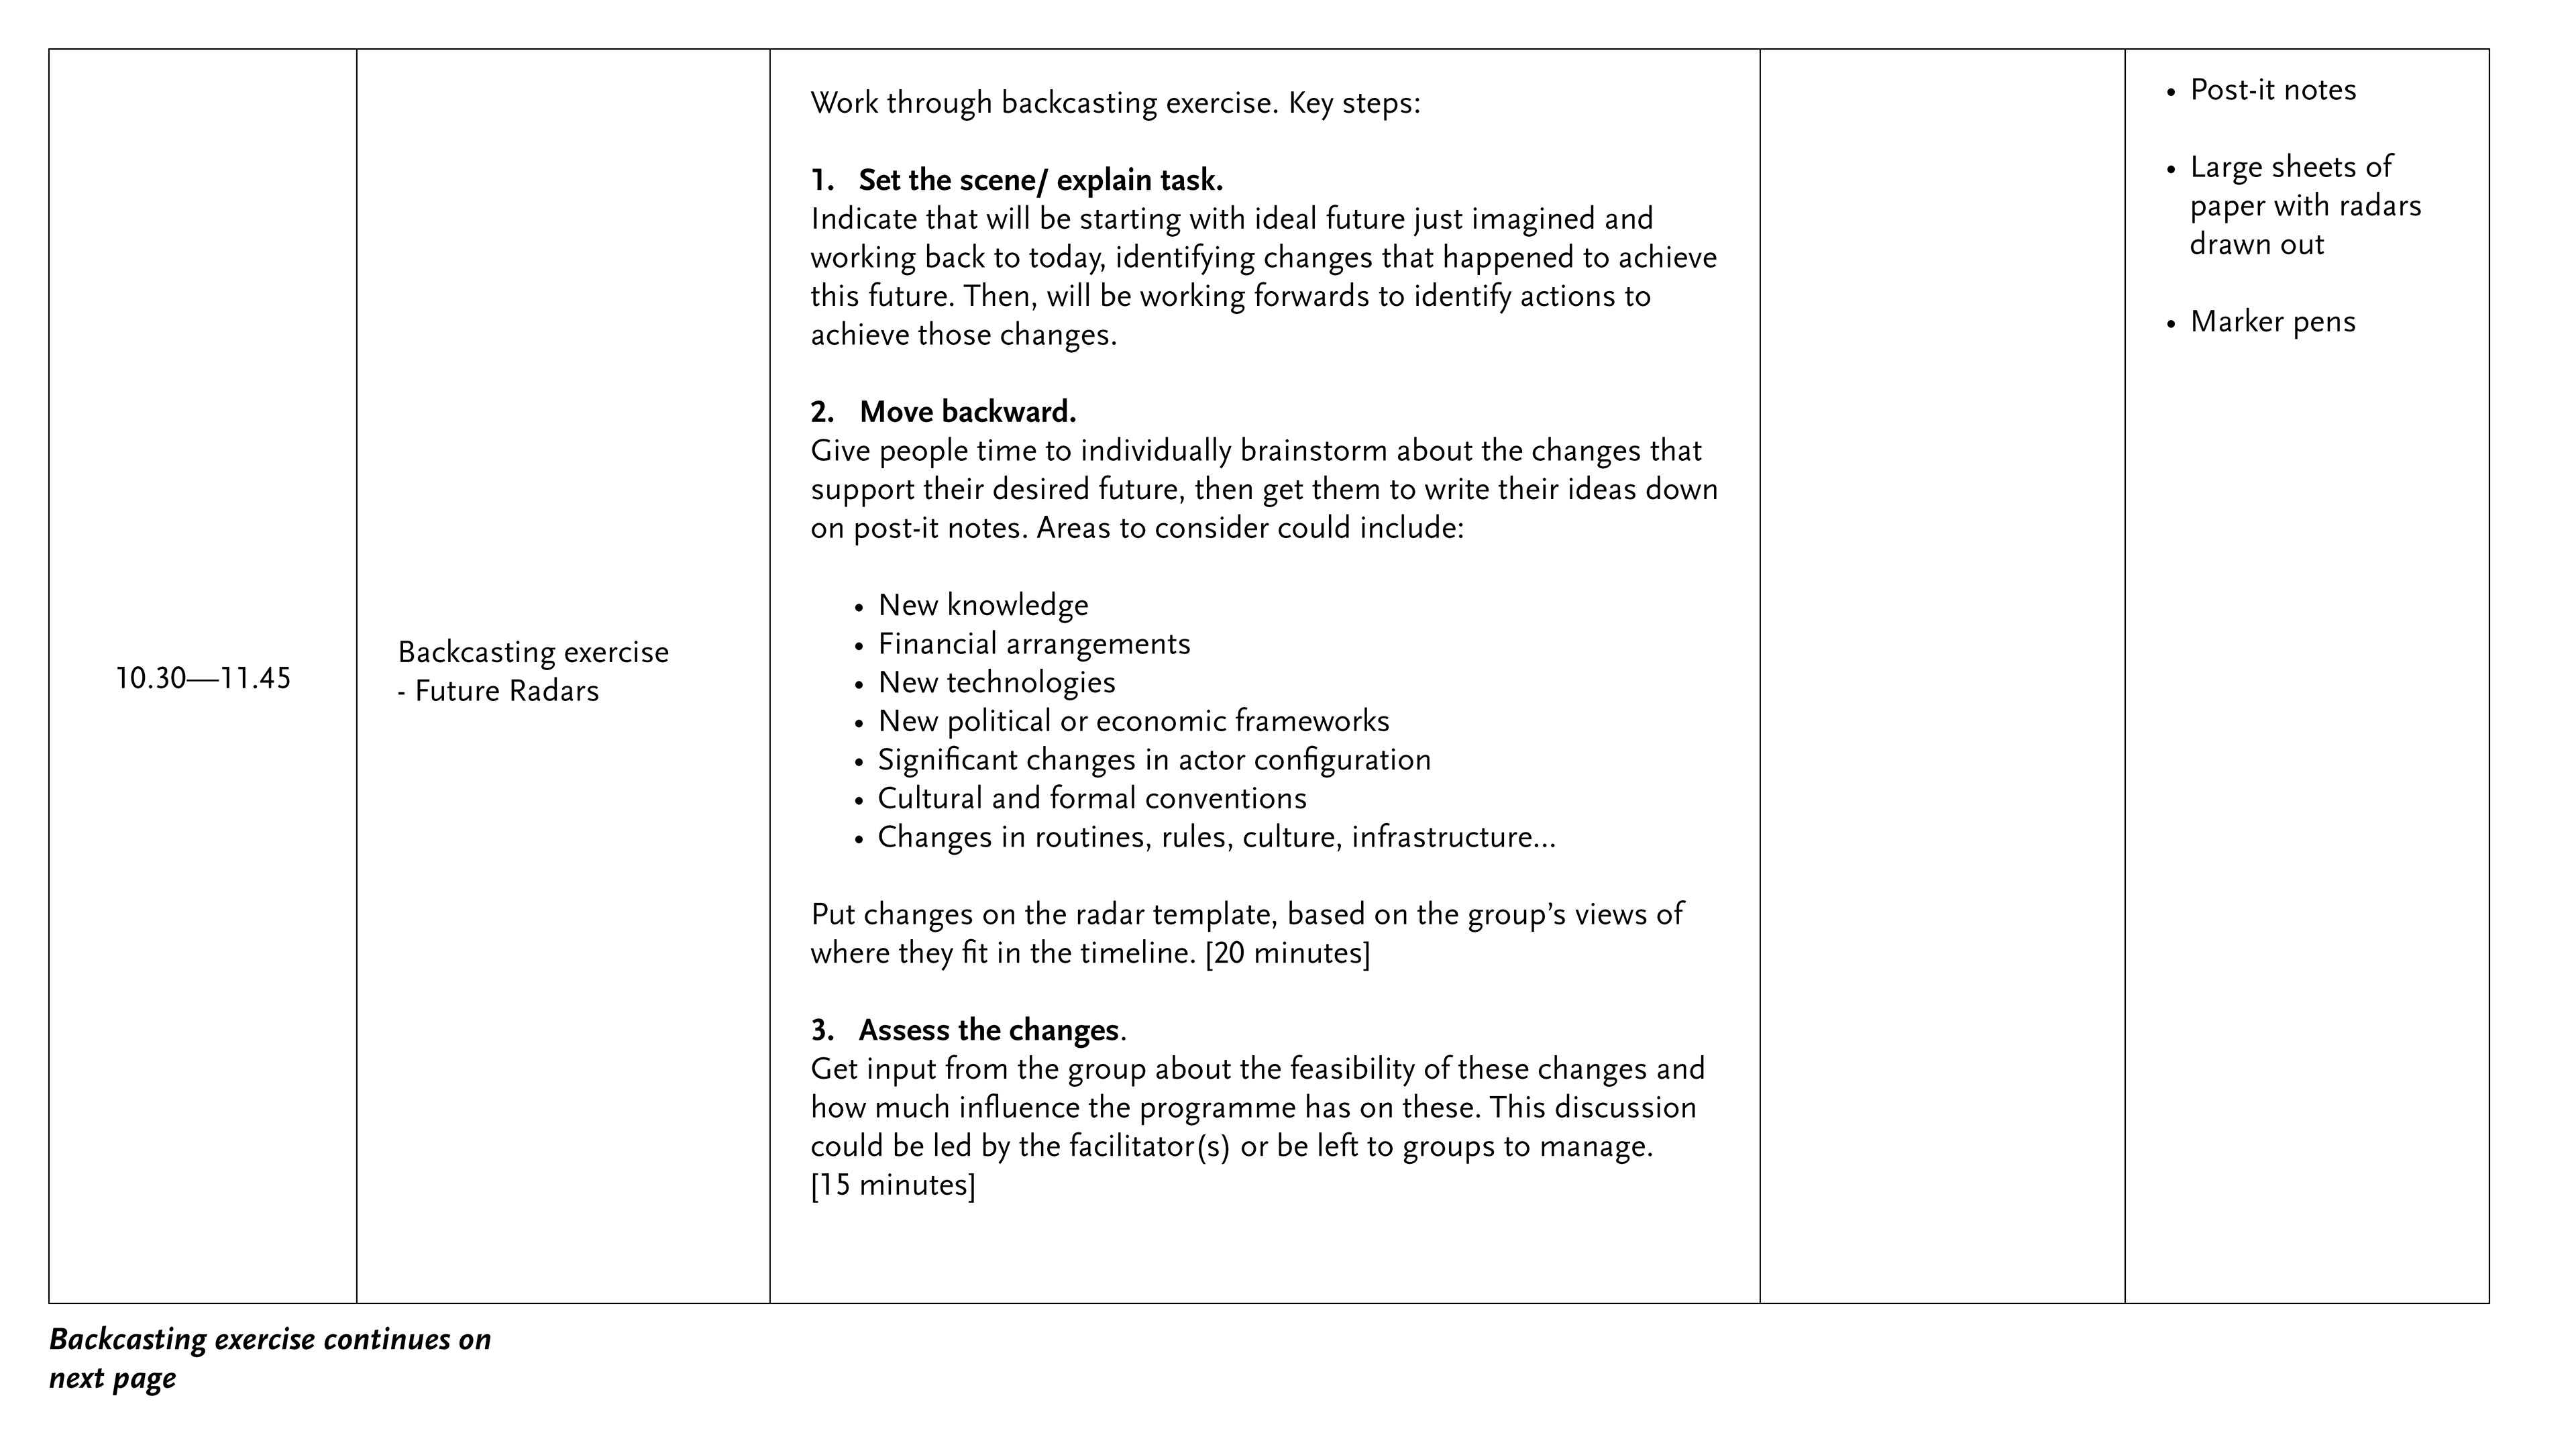
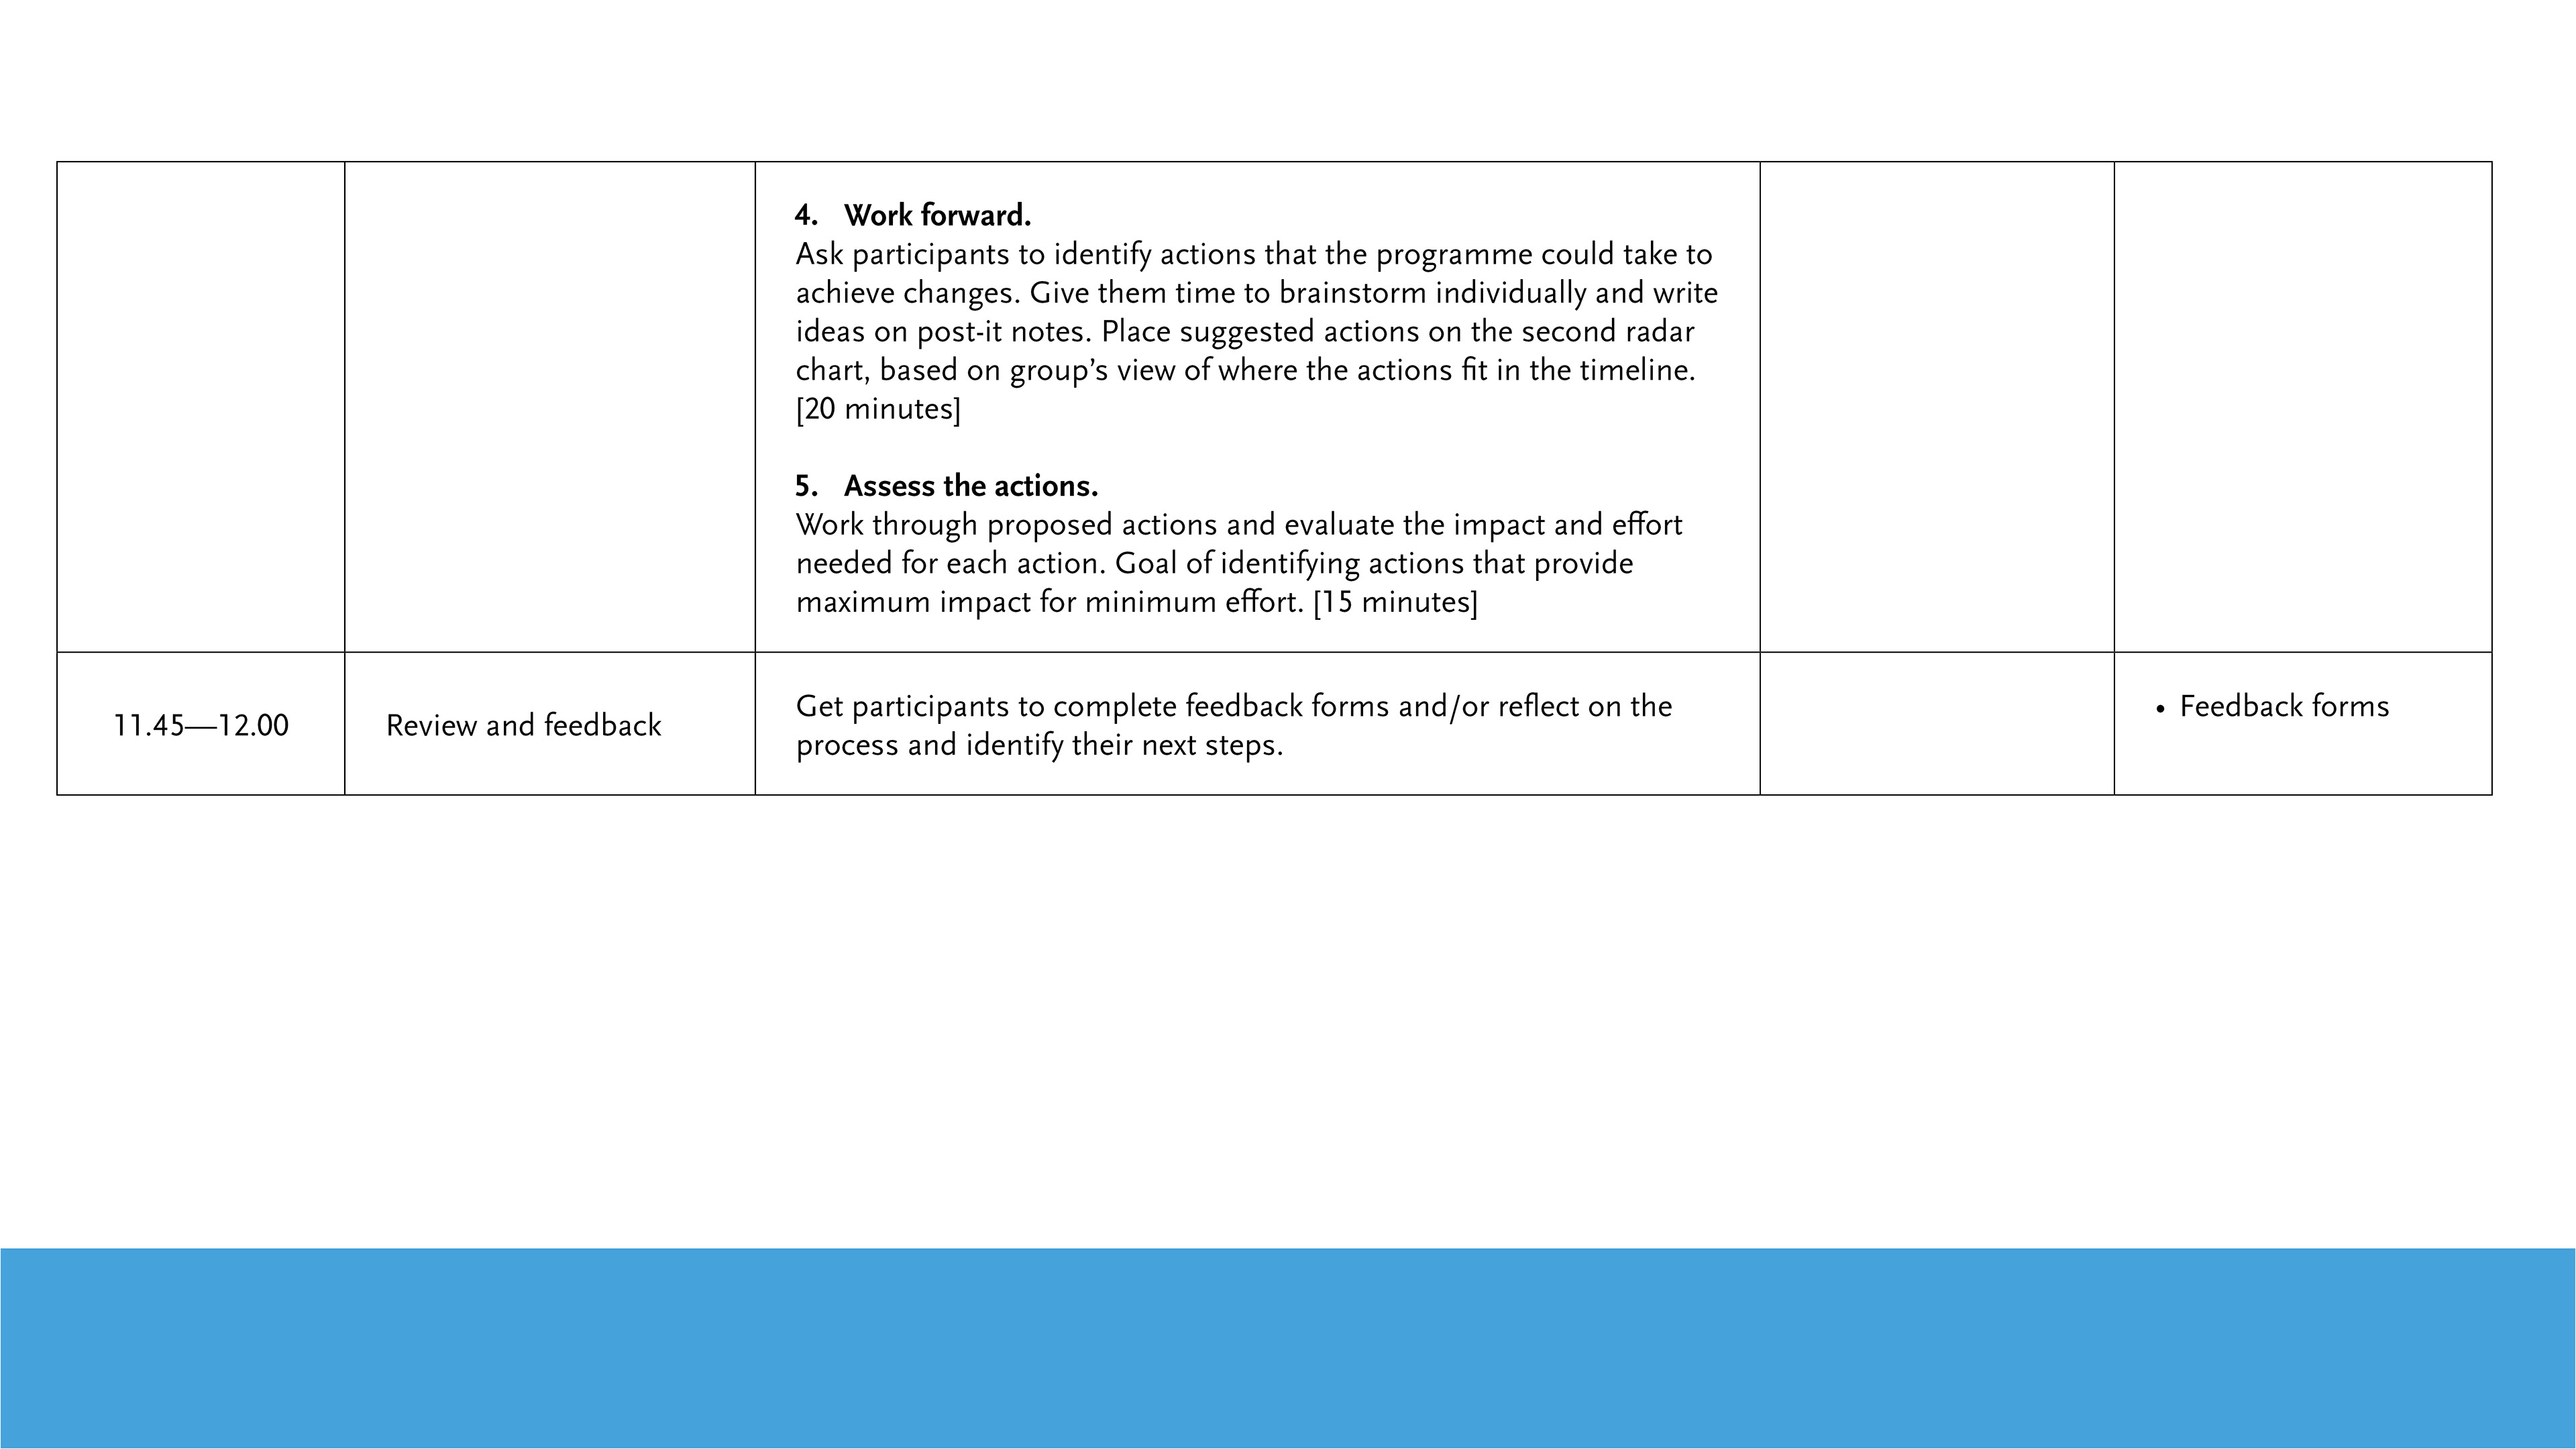
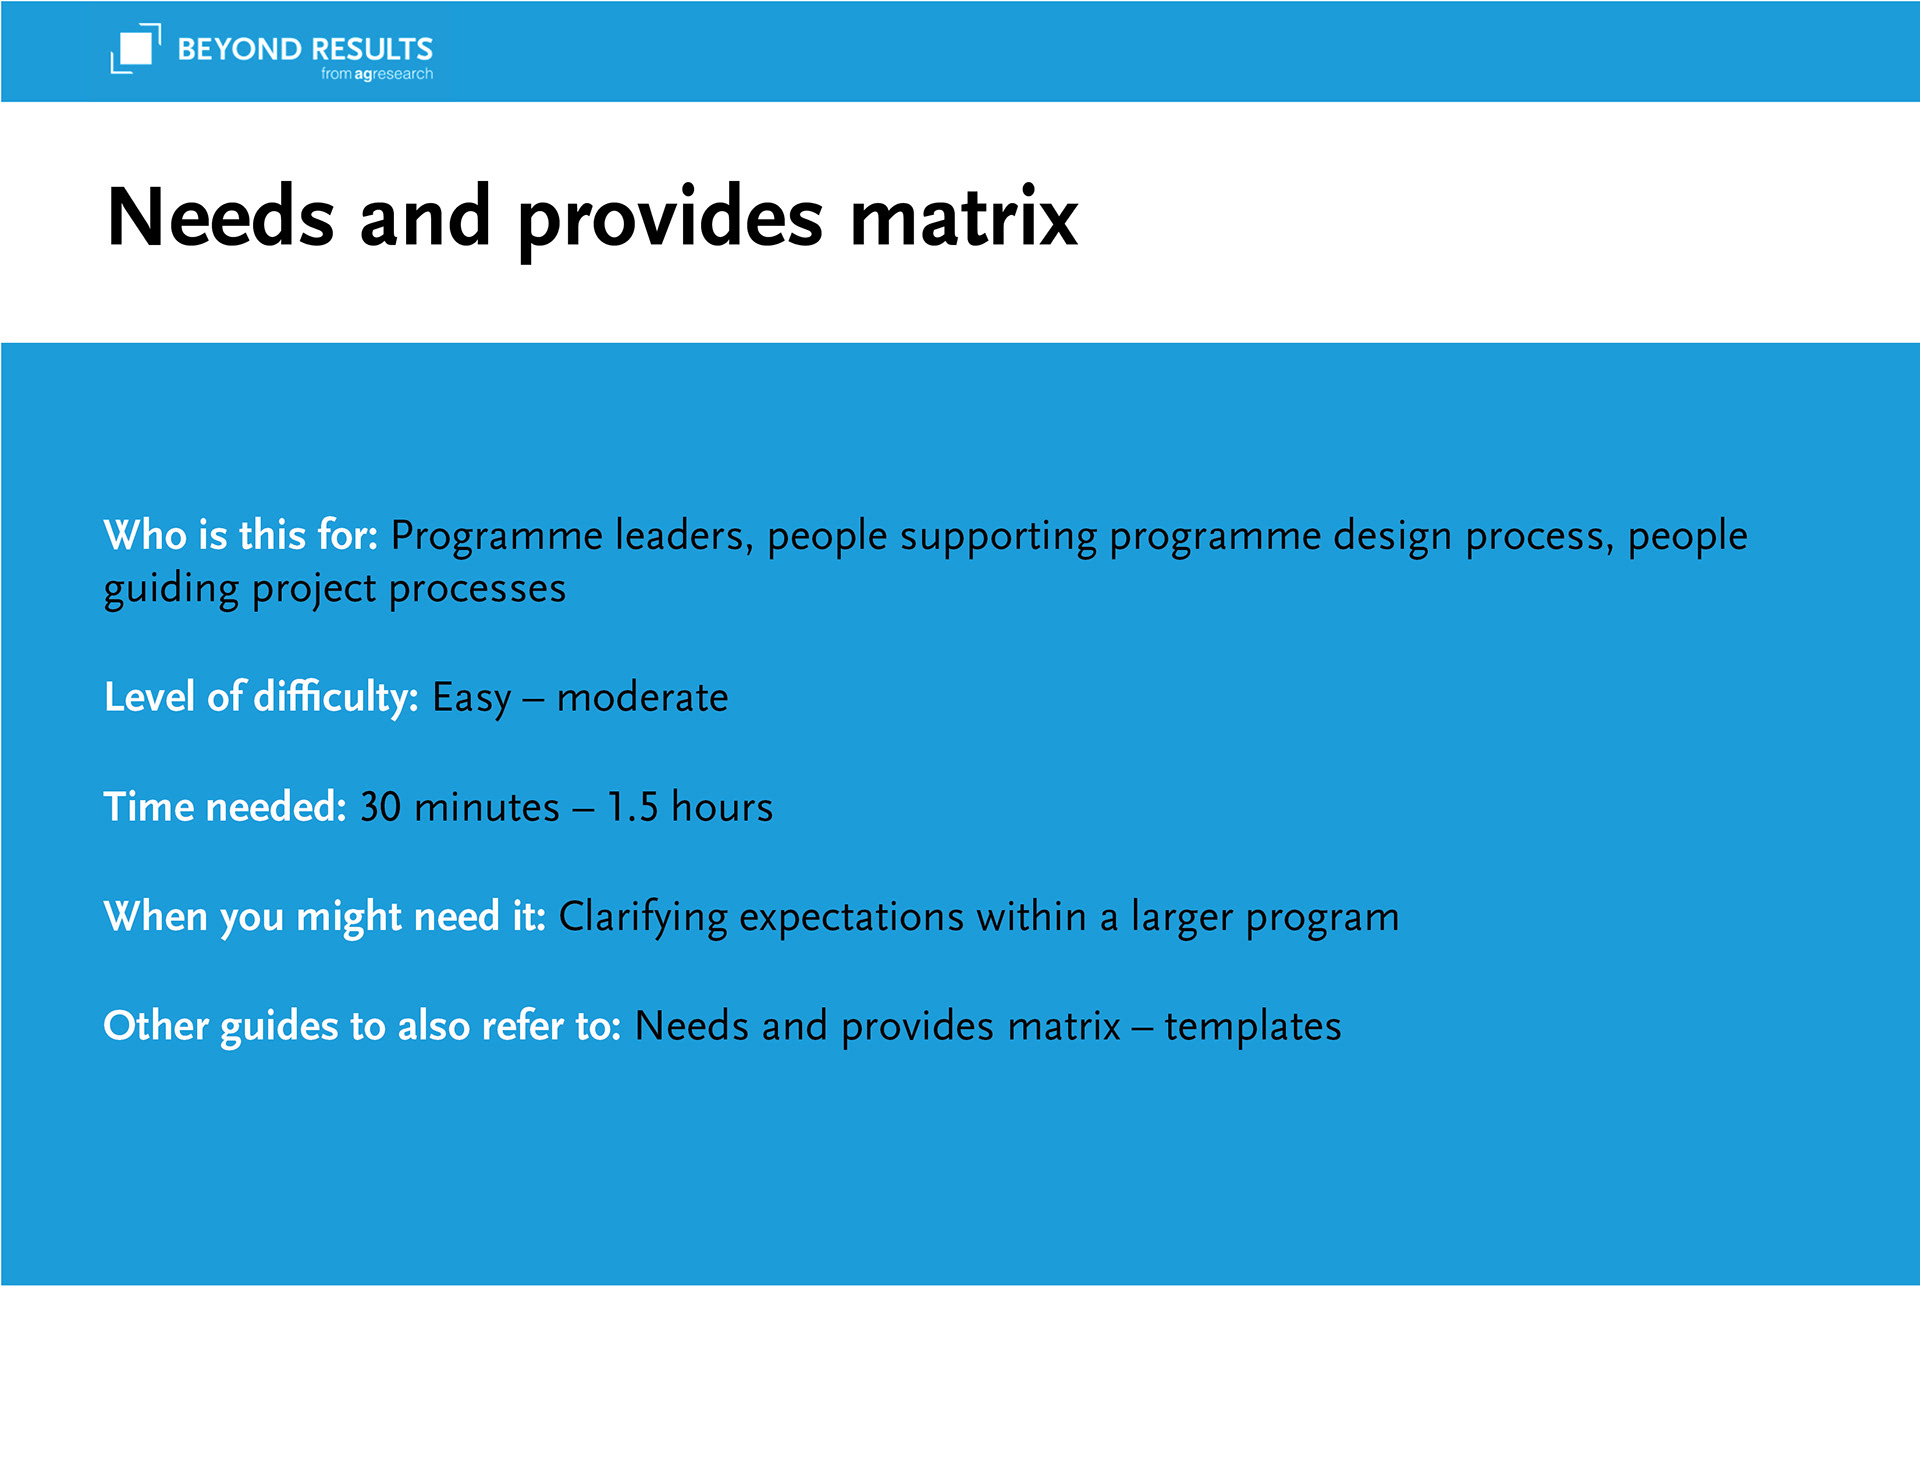
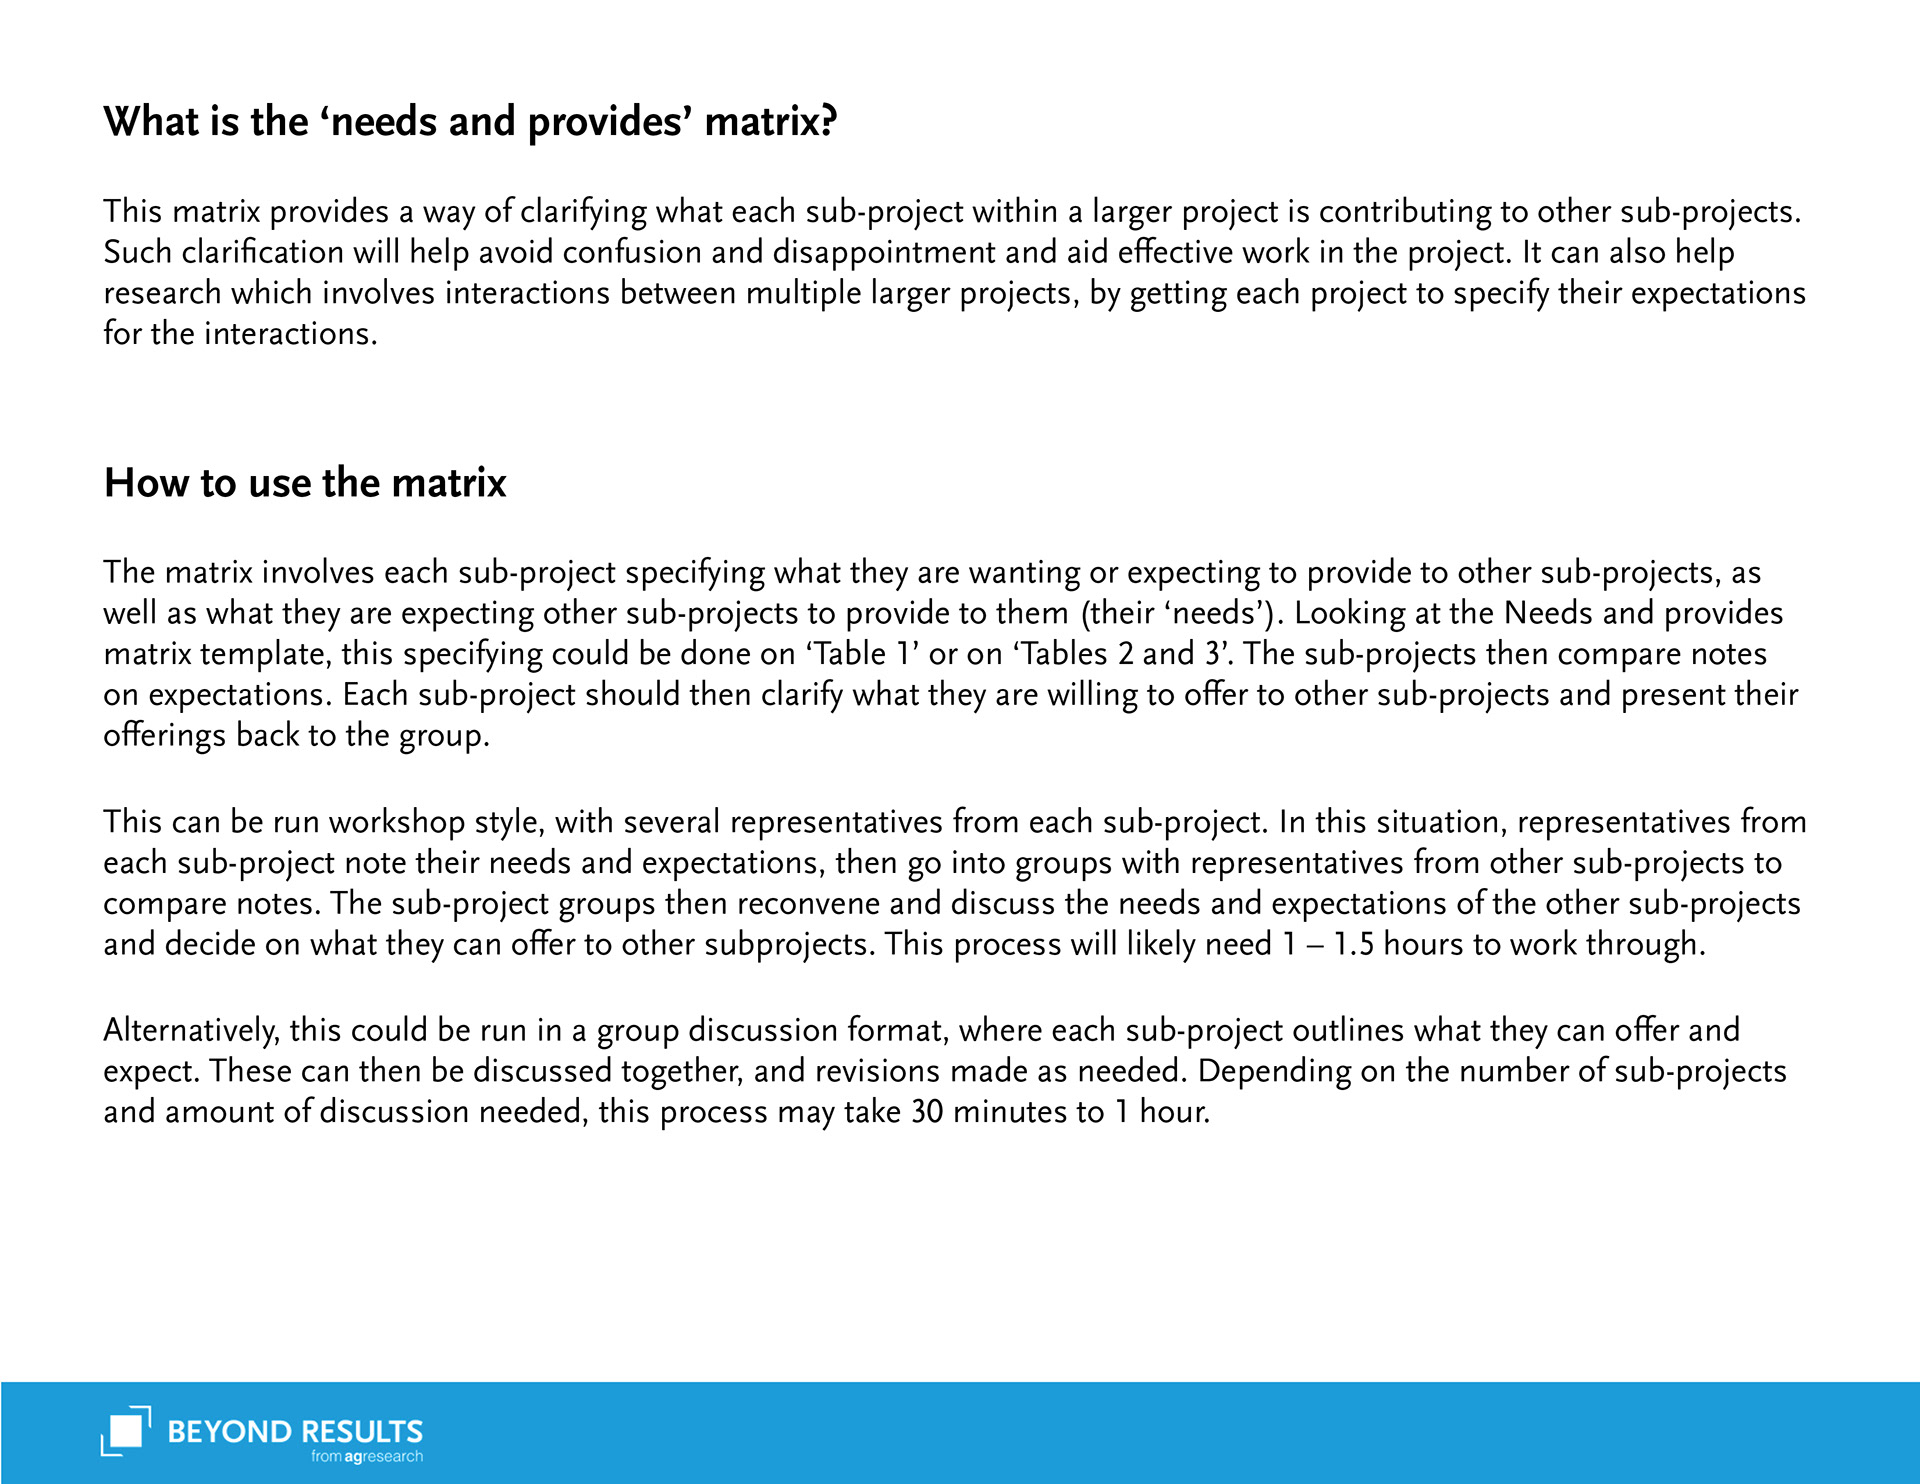
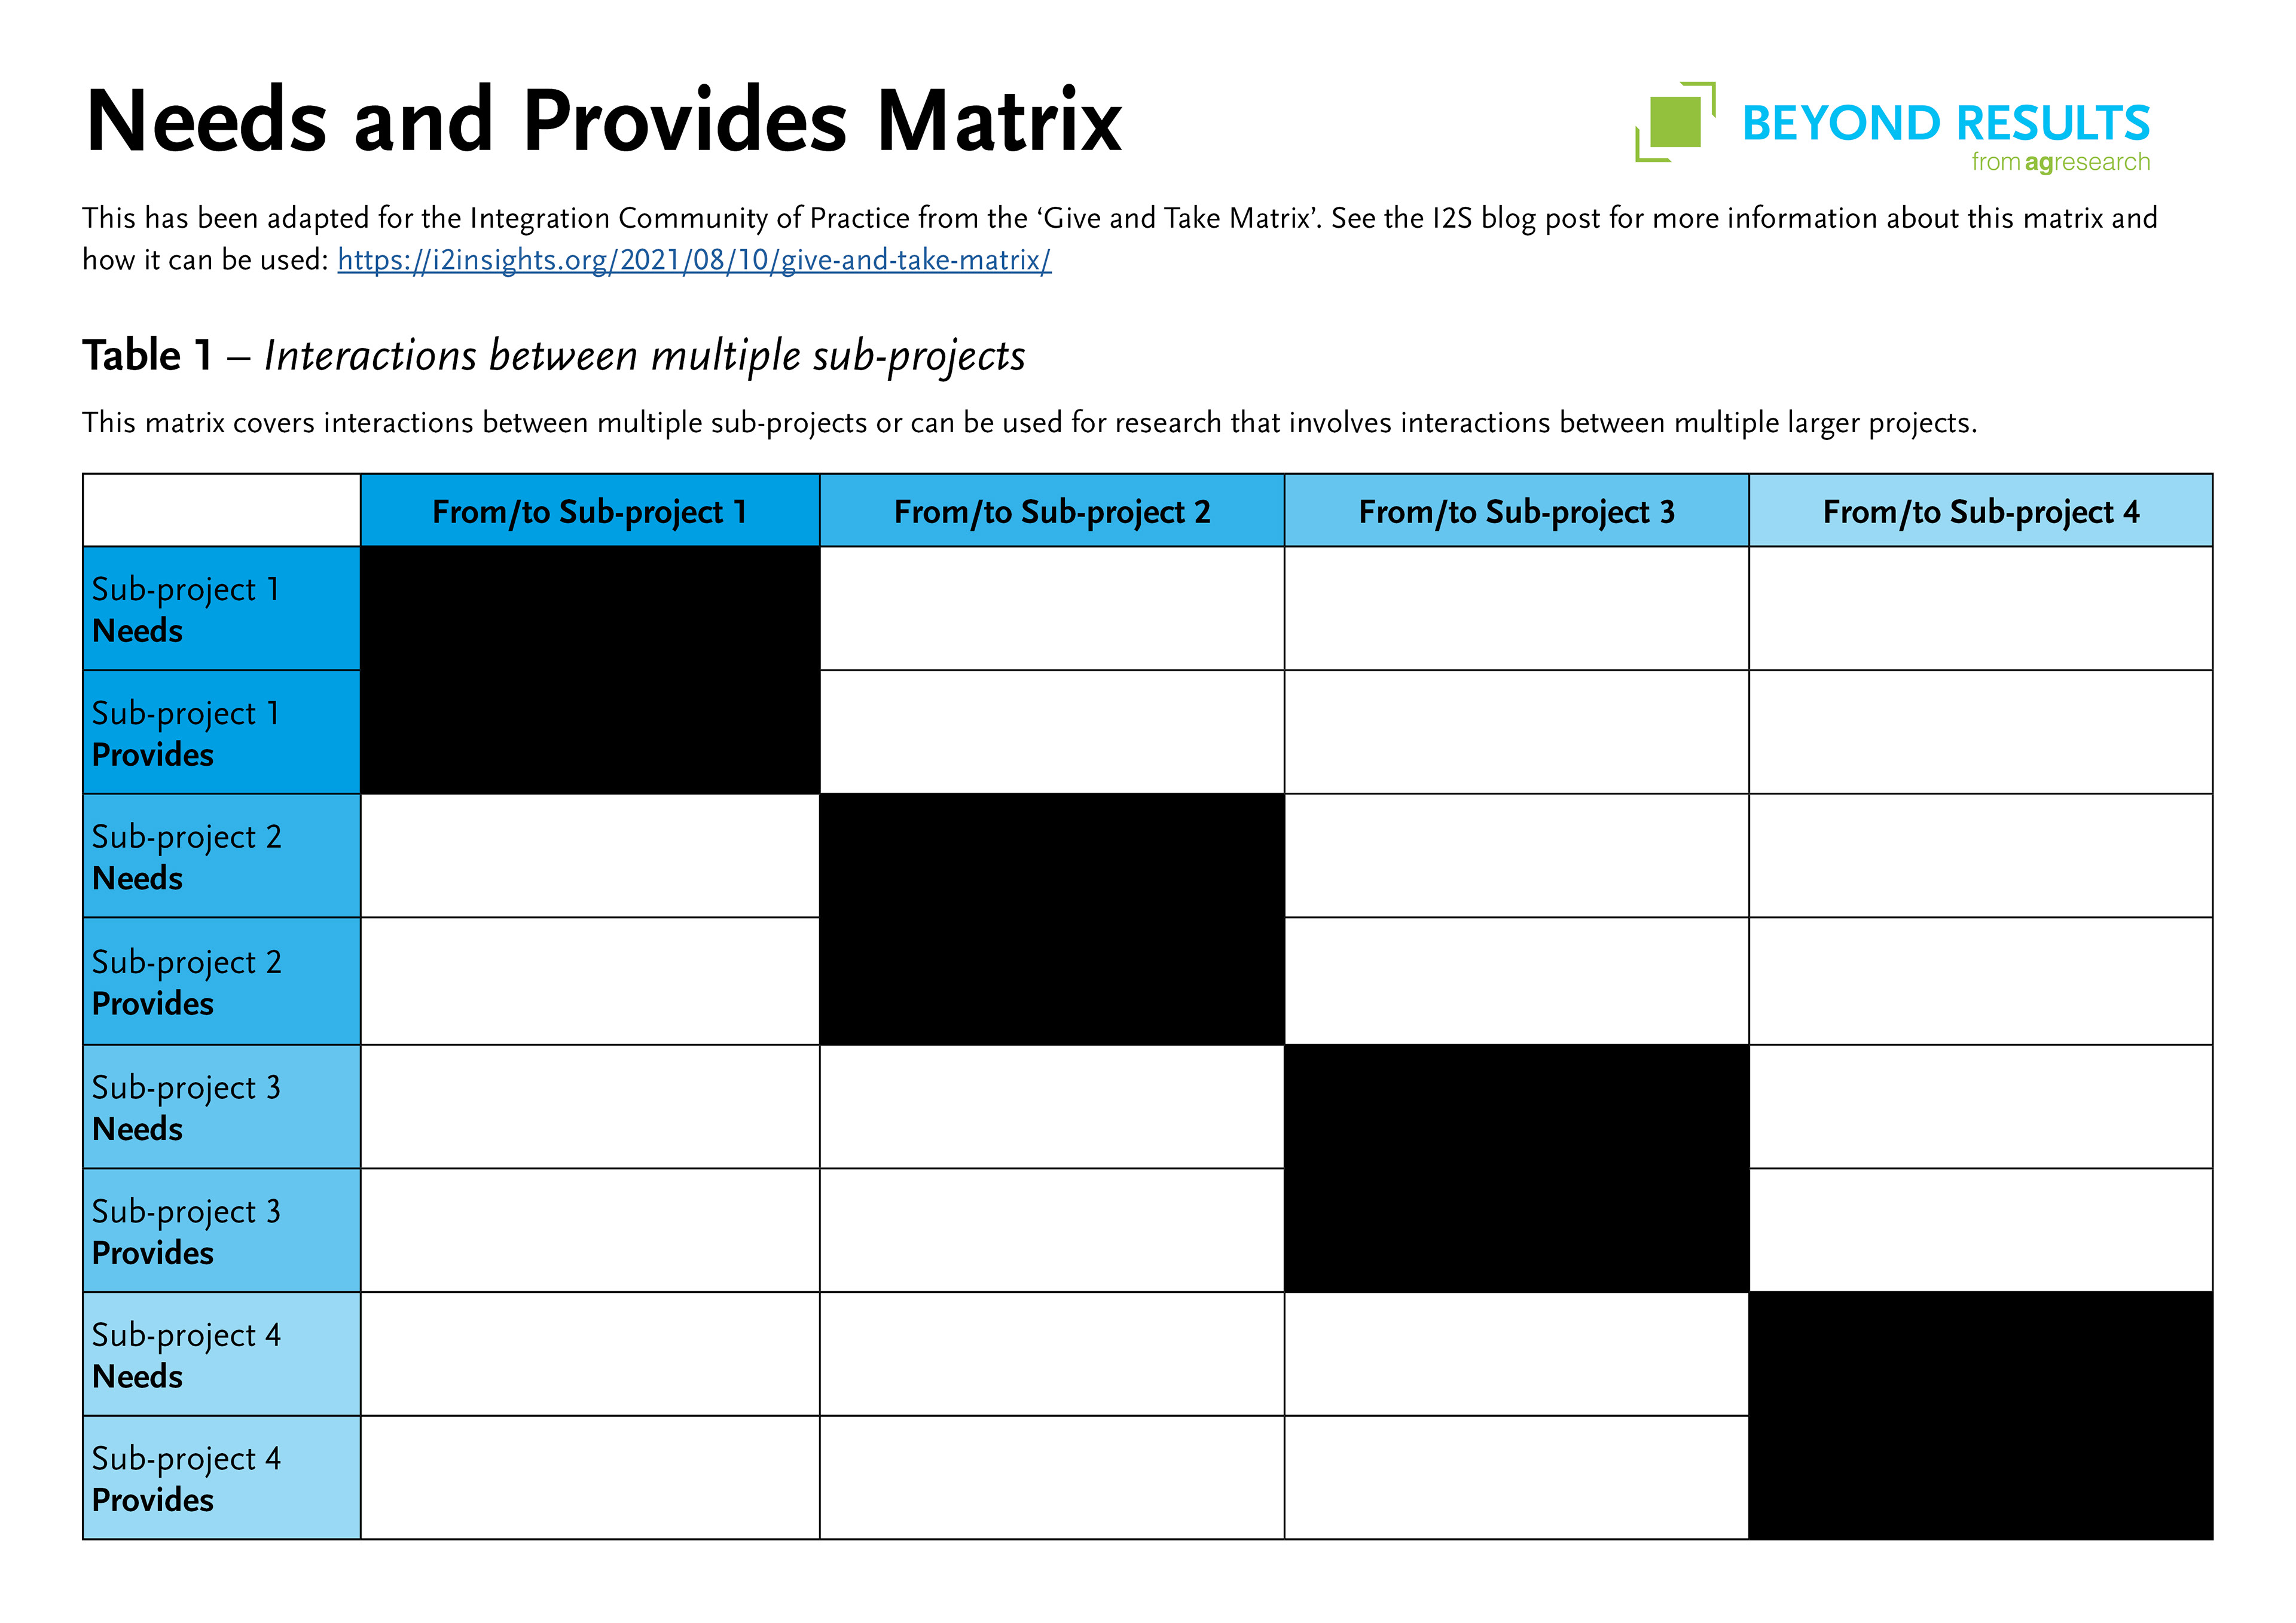
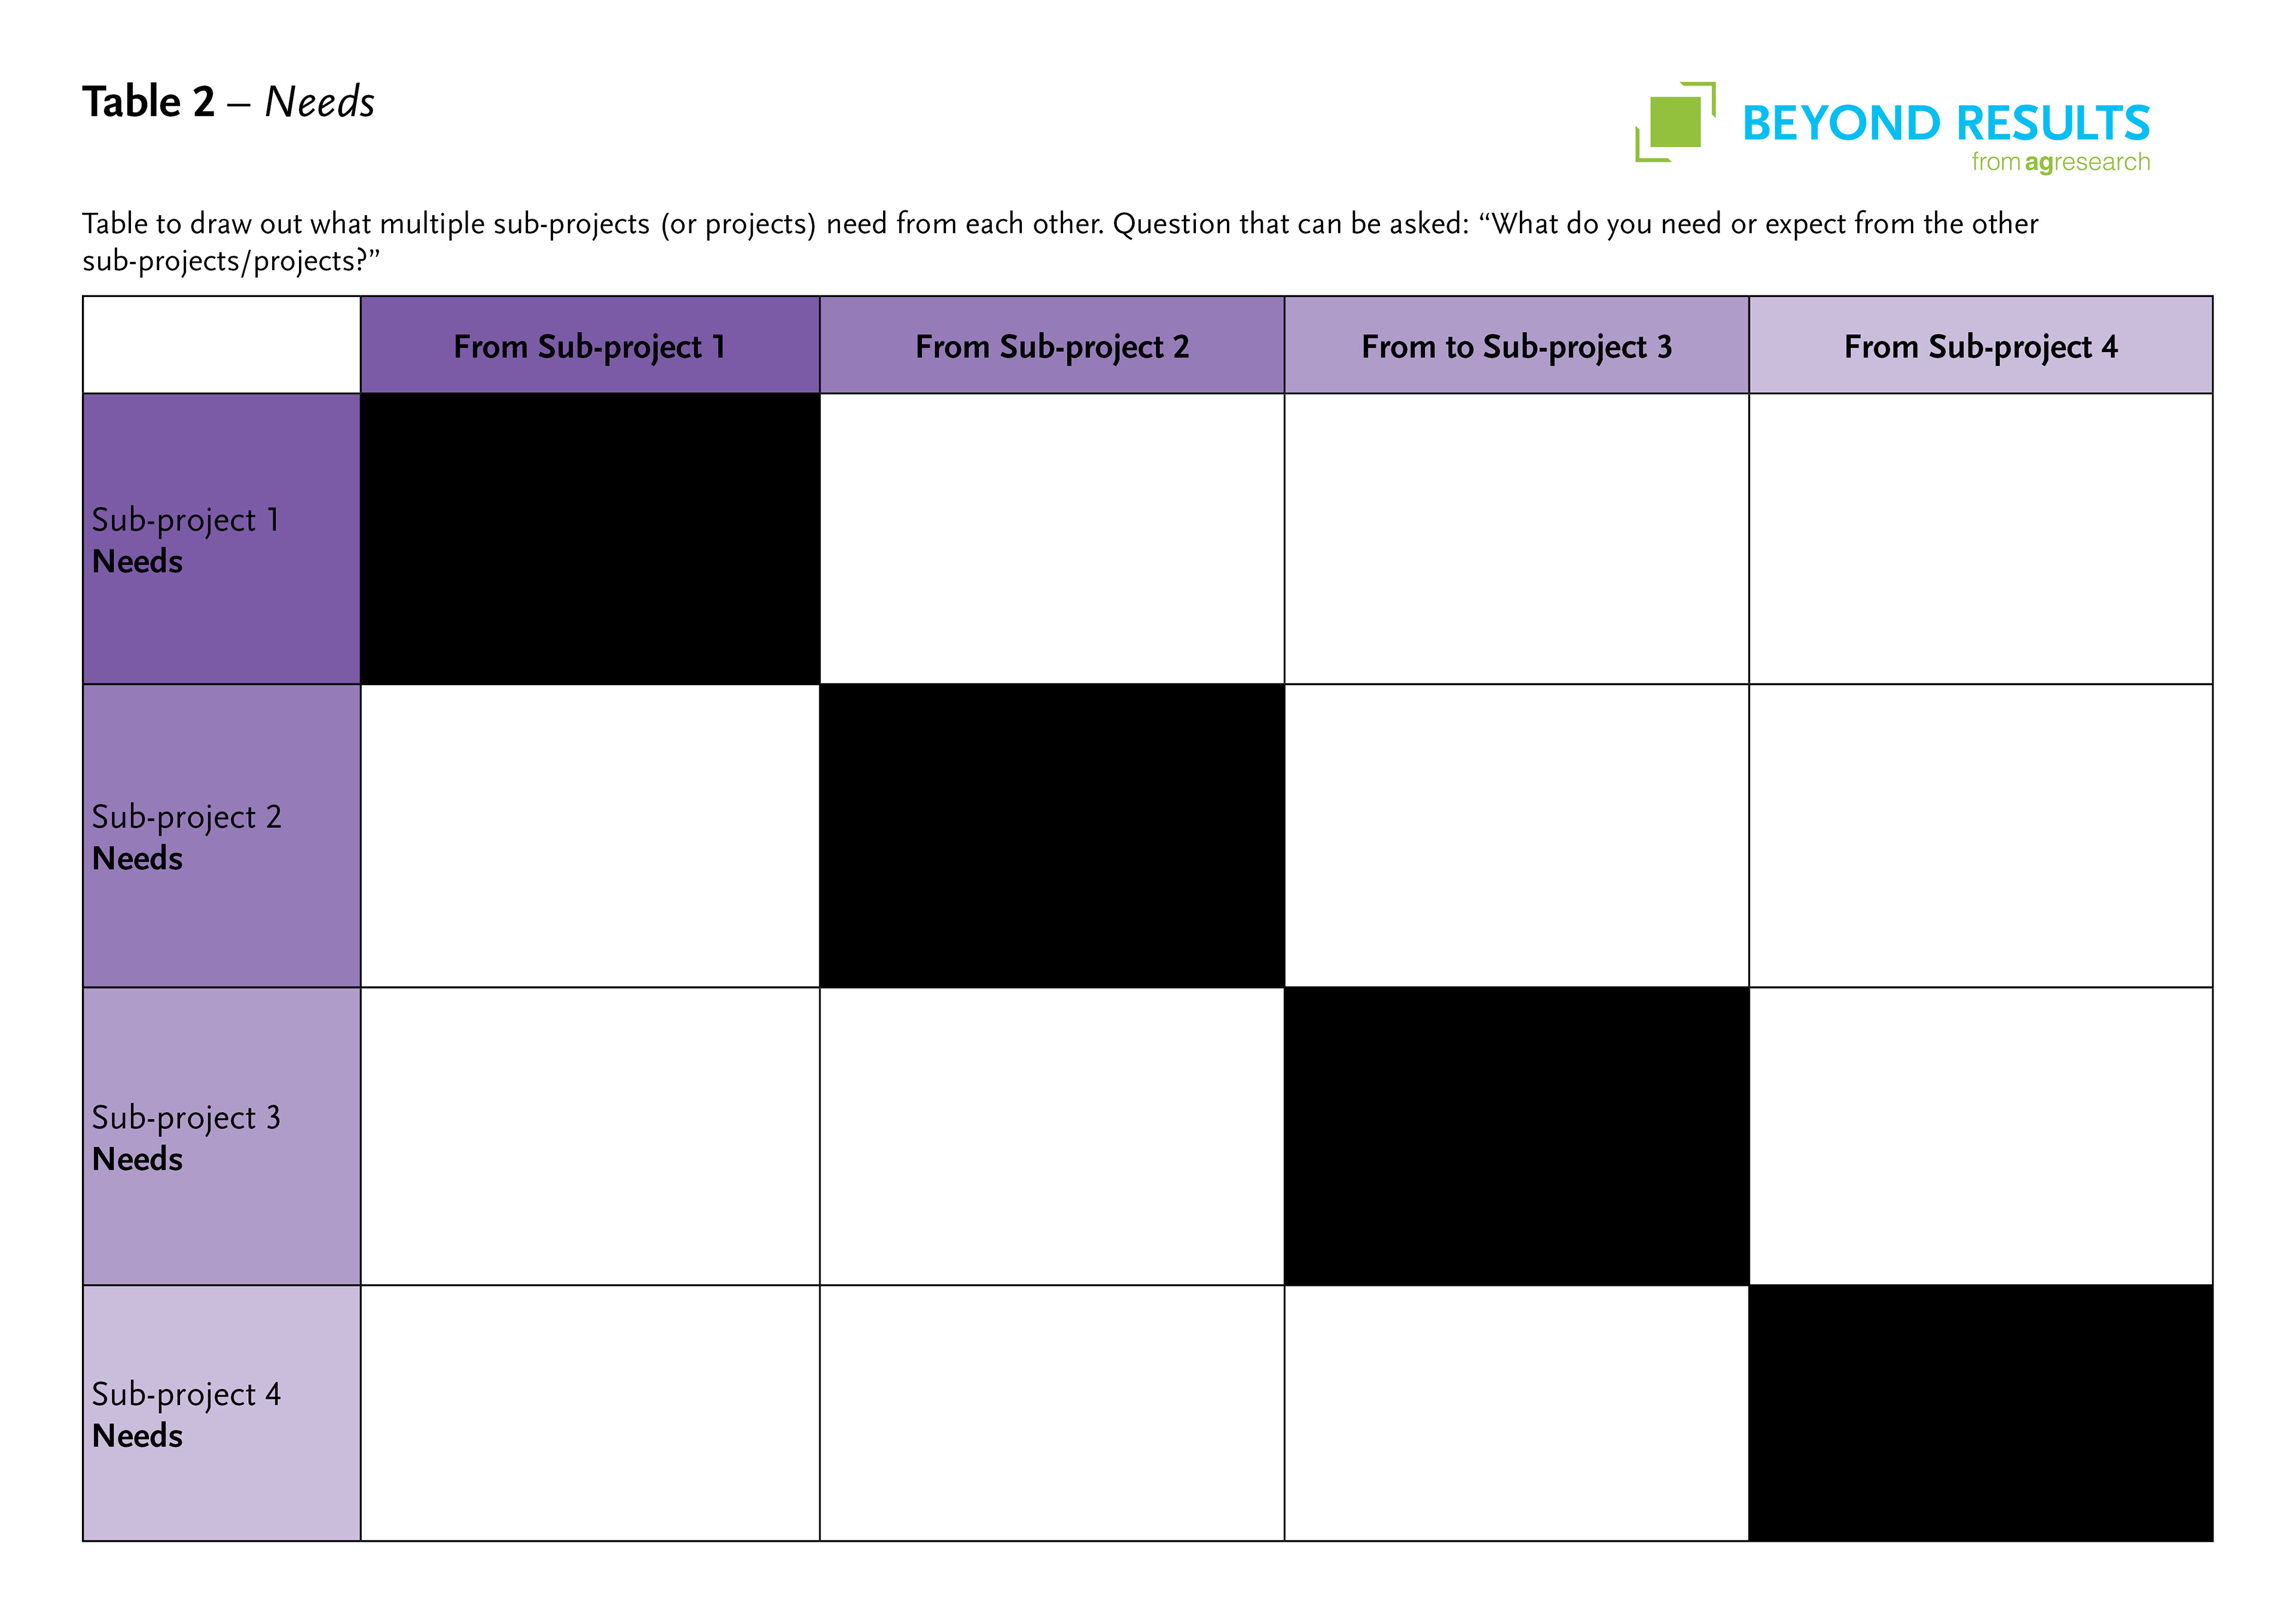
(Below) An example of one of the tools that were created.
Each tool would include a guide, such as below, that would give an overview of the related workshop. It would then have one formatted PDF run sheet, and one editable word document version of the run sheet to go with it.
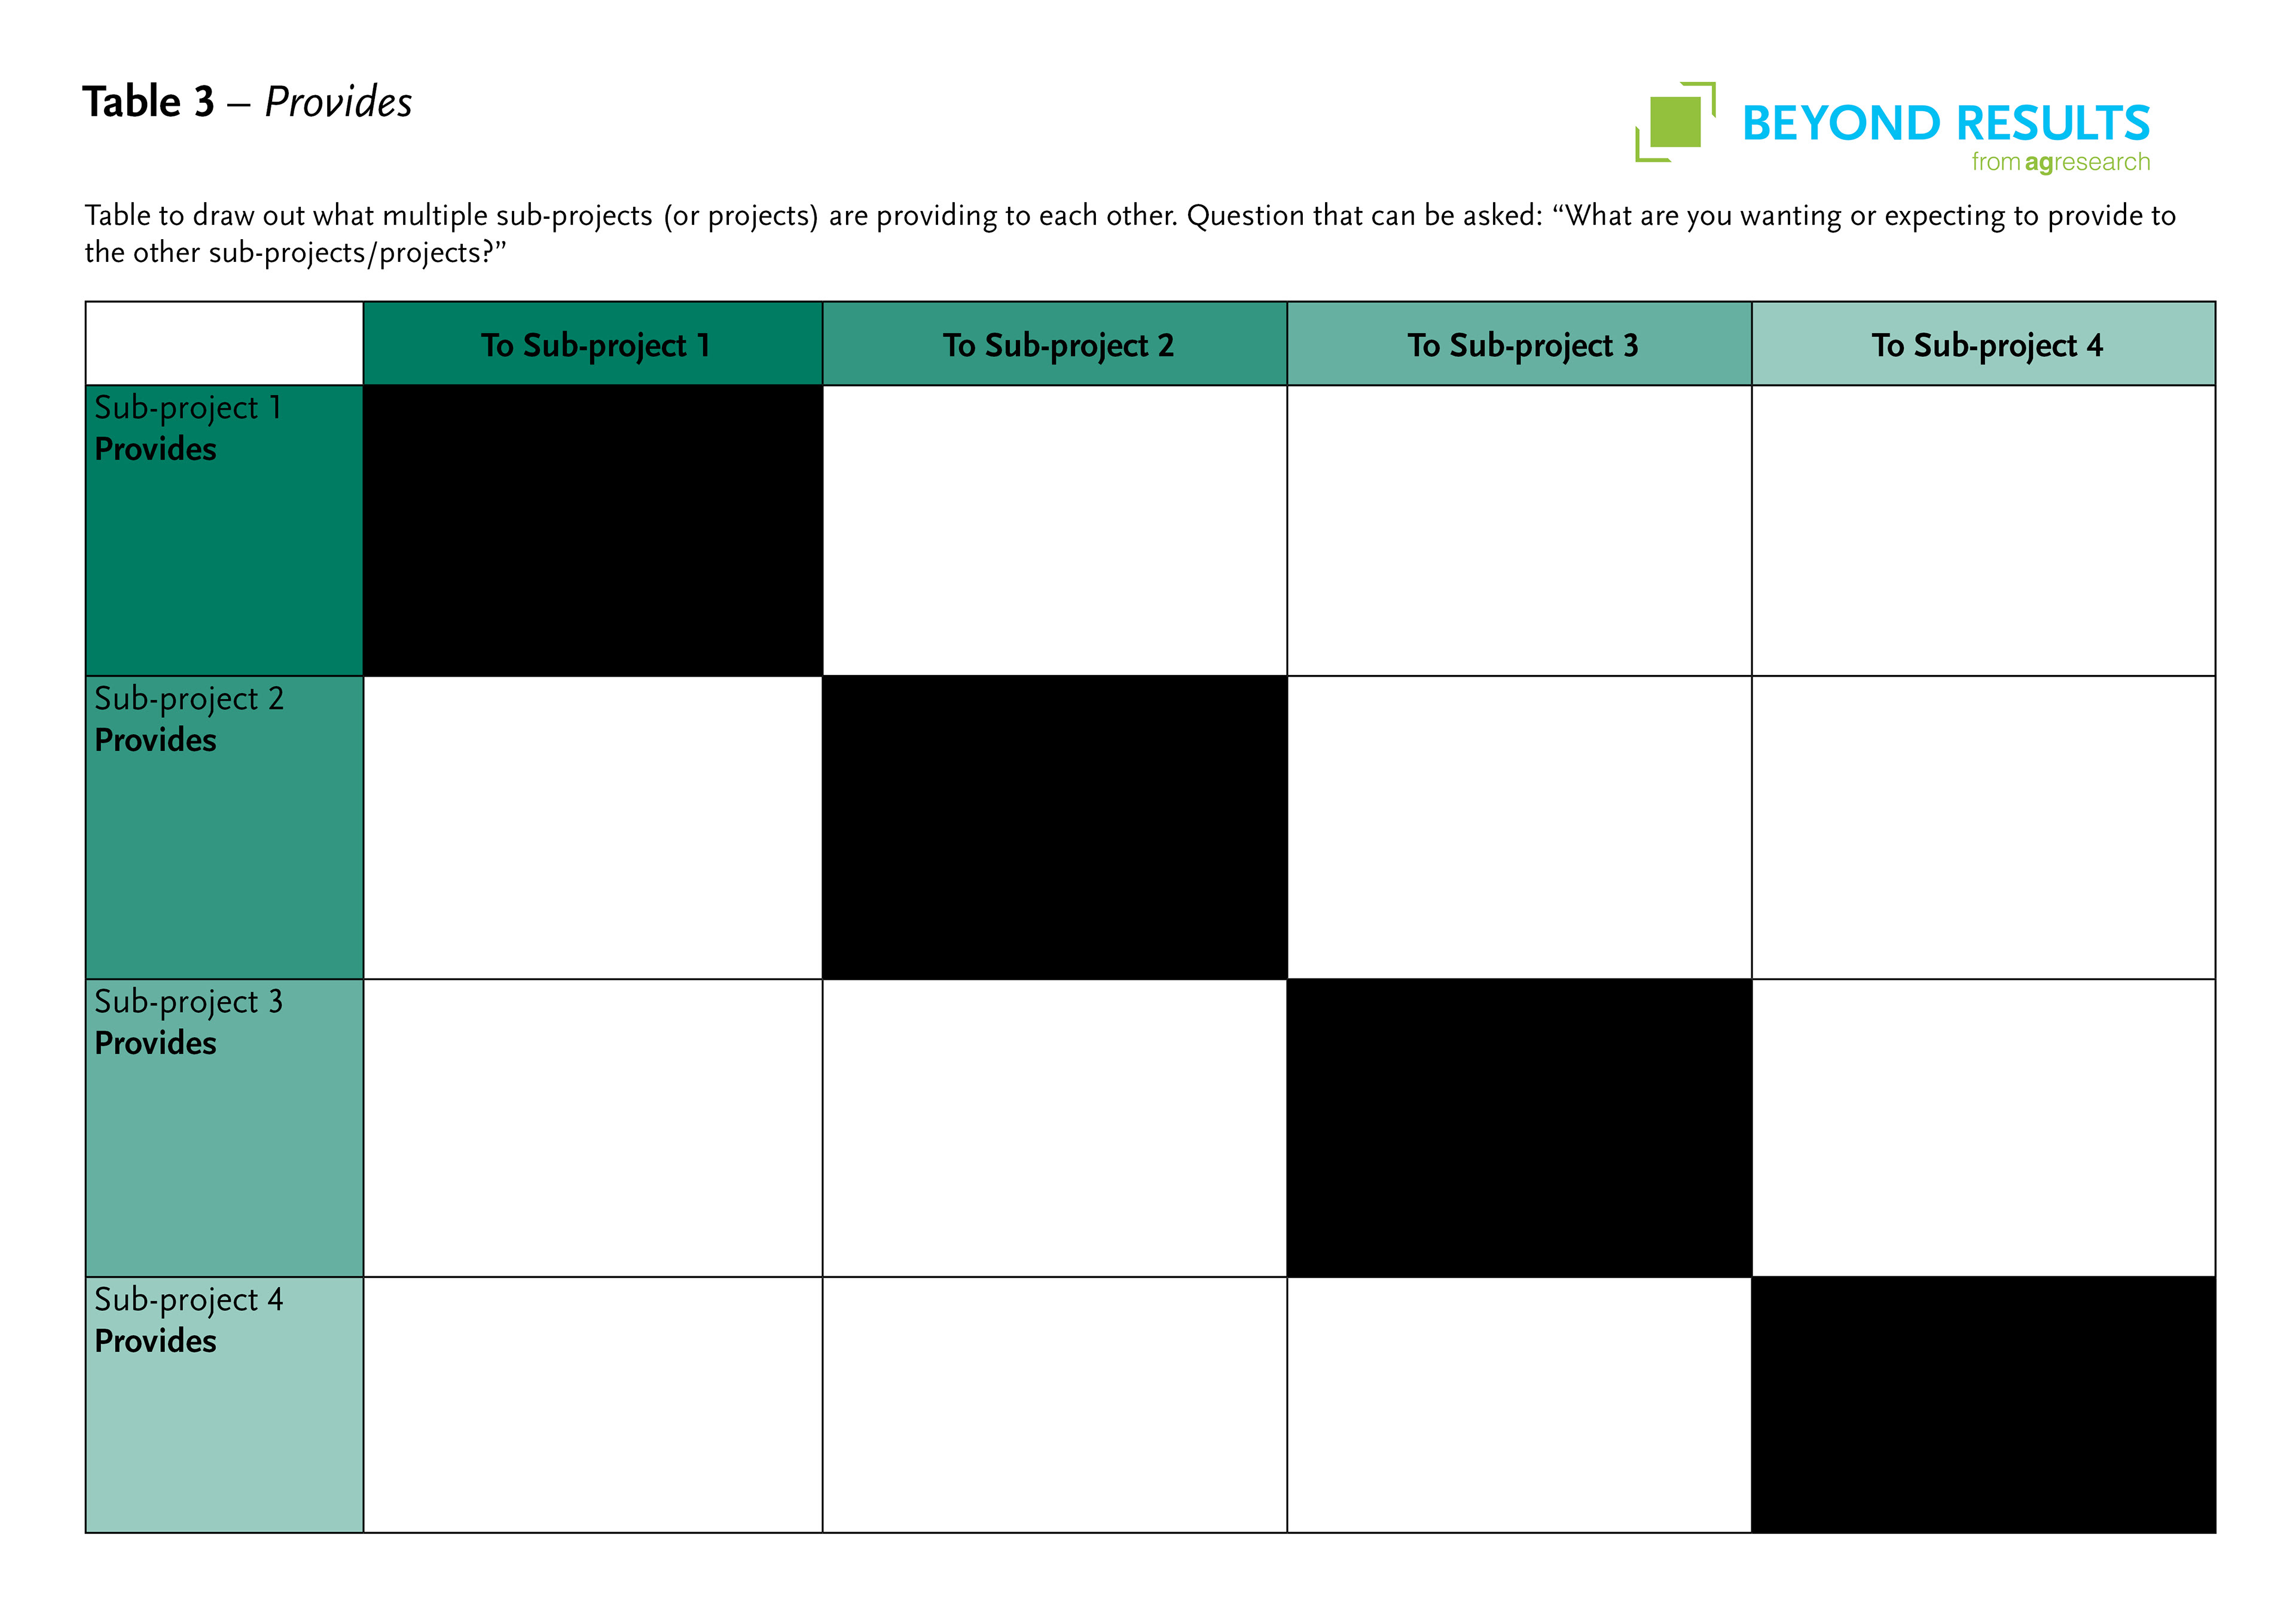
Another example of a tool that was reformatted.
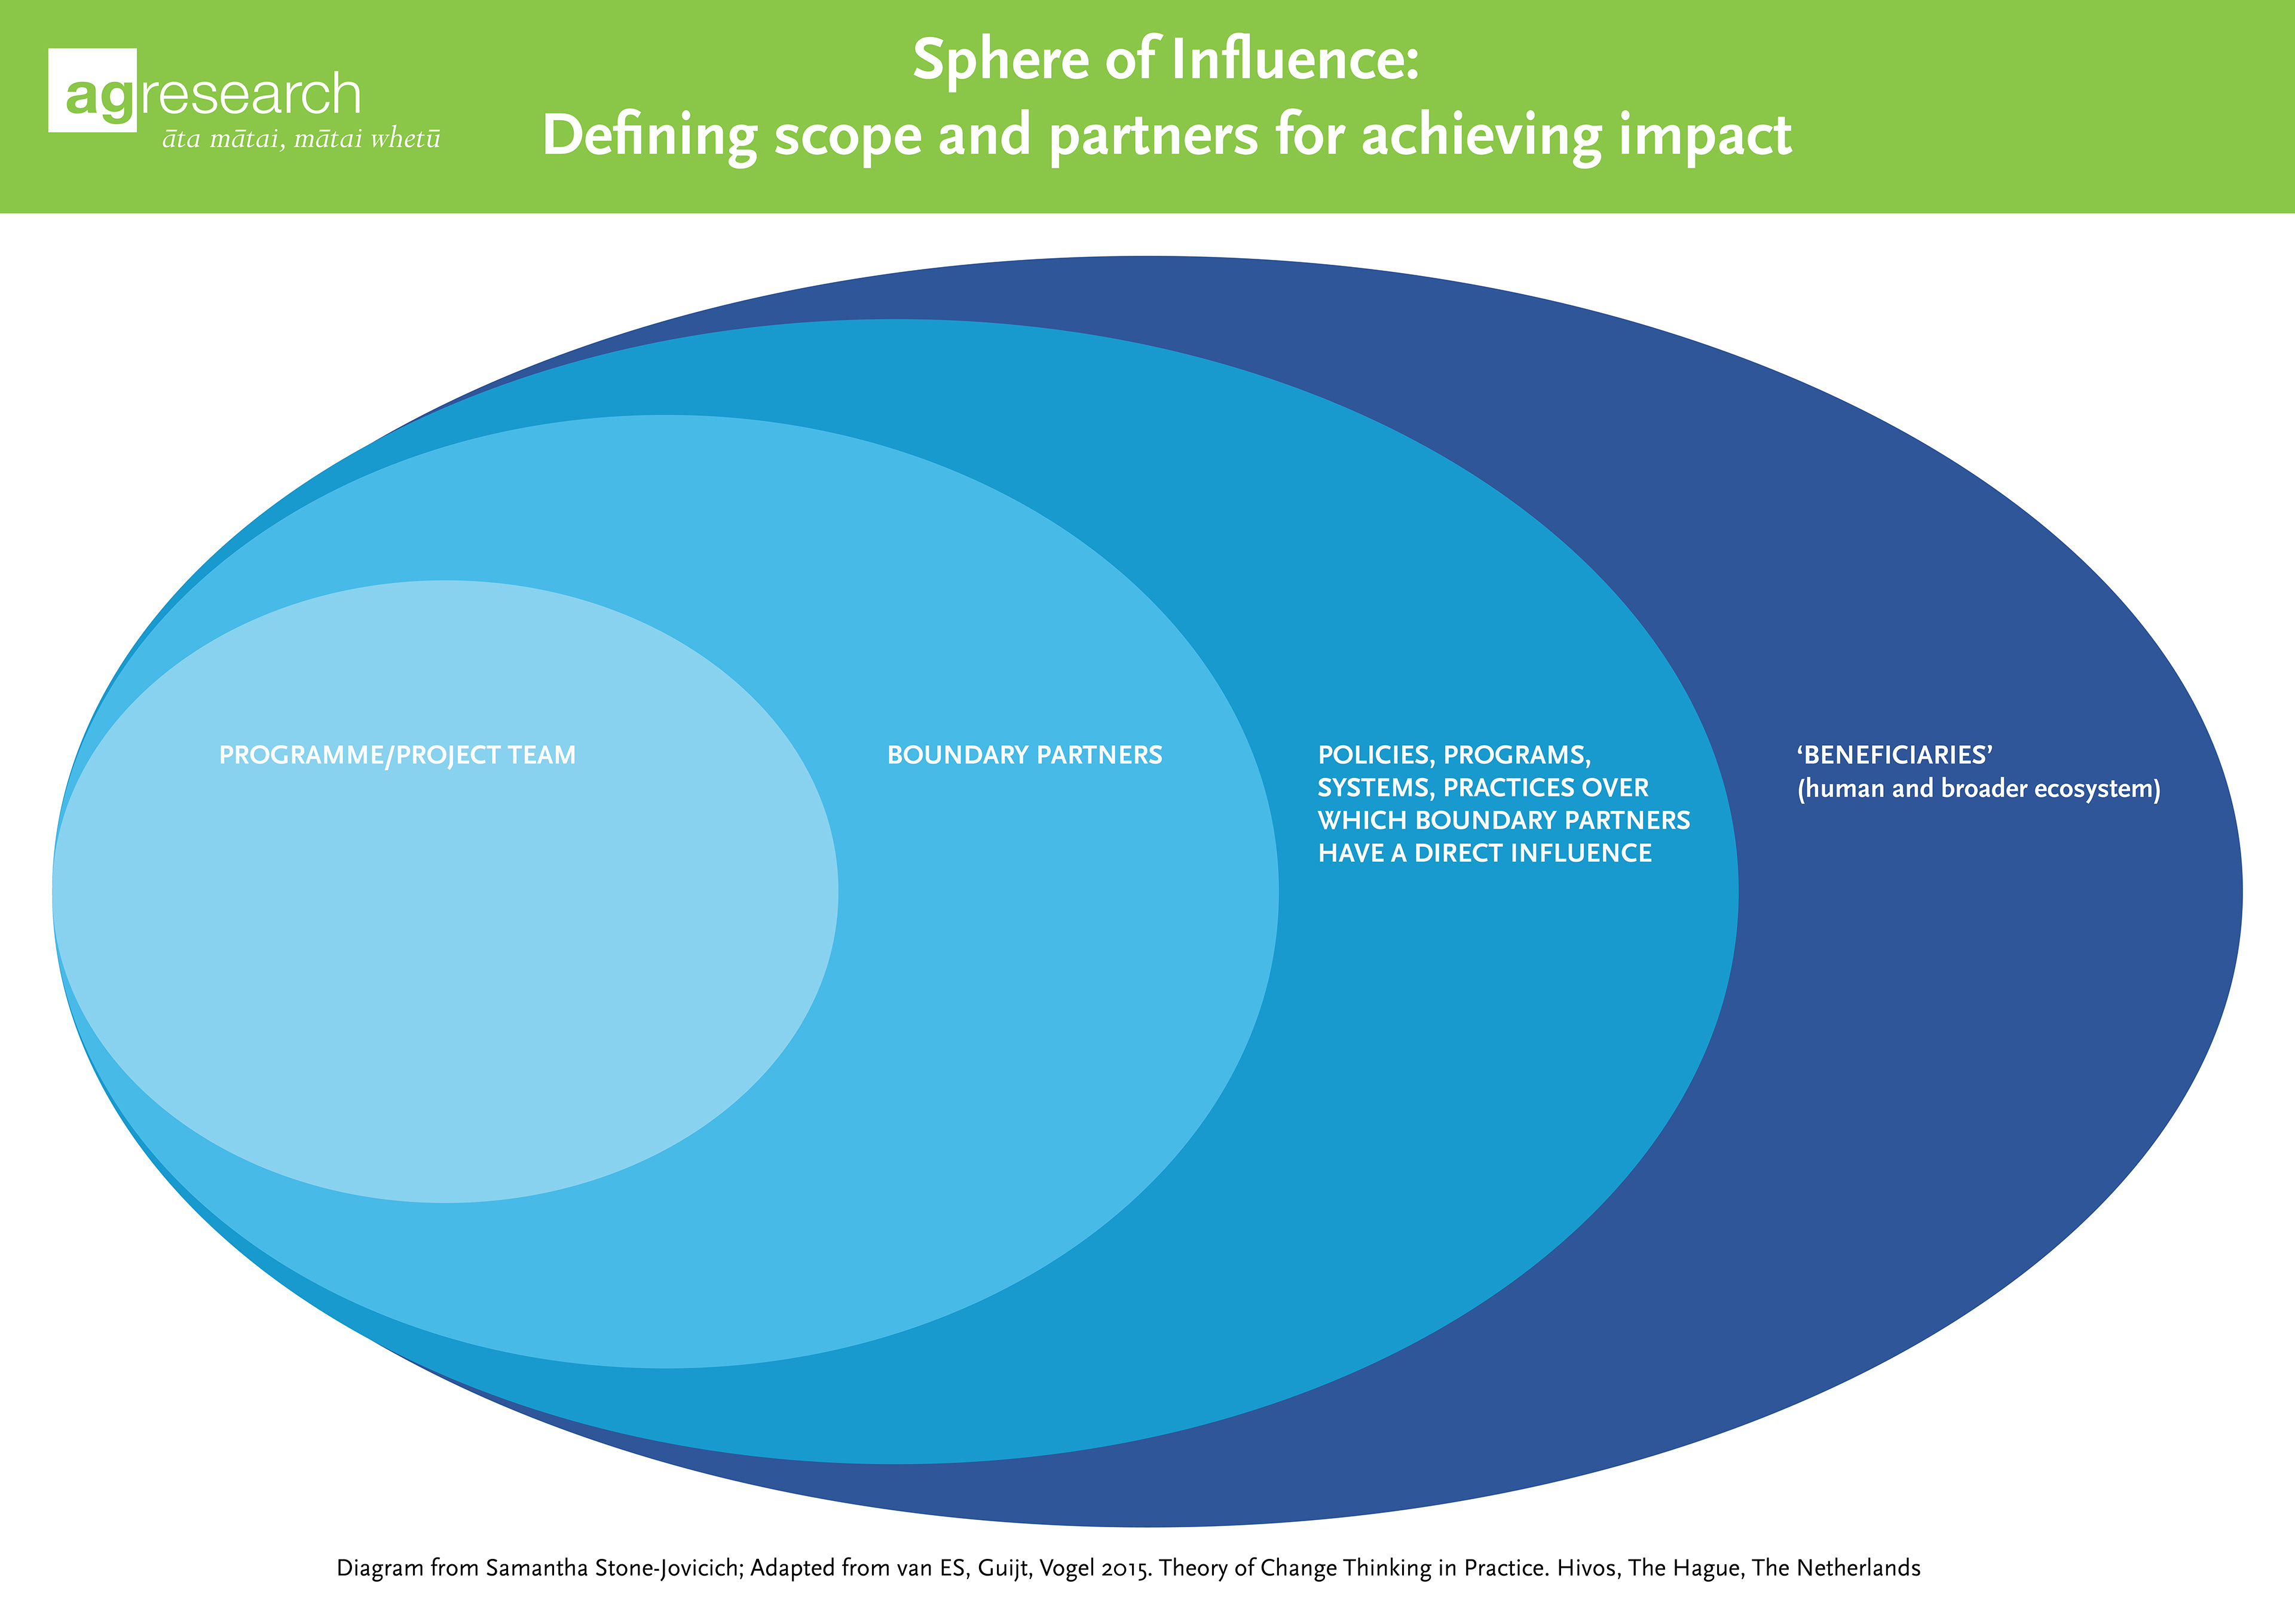
Tools such as the Sphere of Influence below would be used in stakeholder workshops alongside other tools.
(Below) An example of a reformatted research paper.
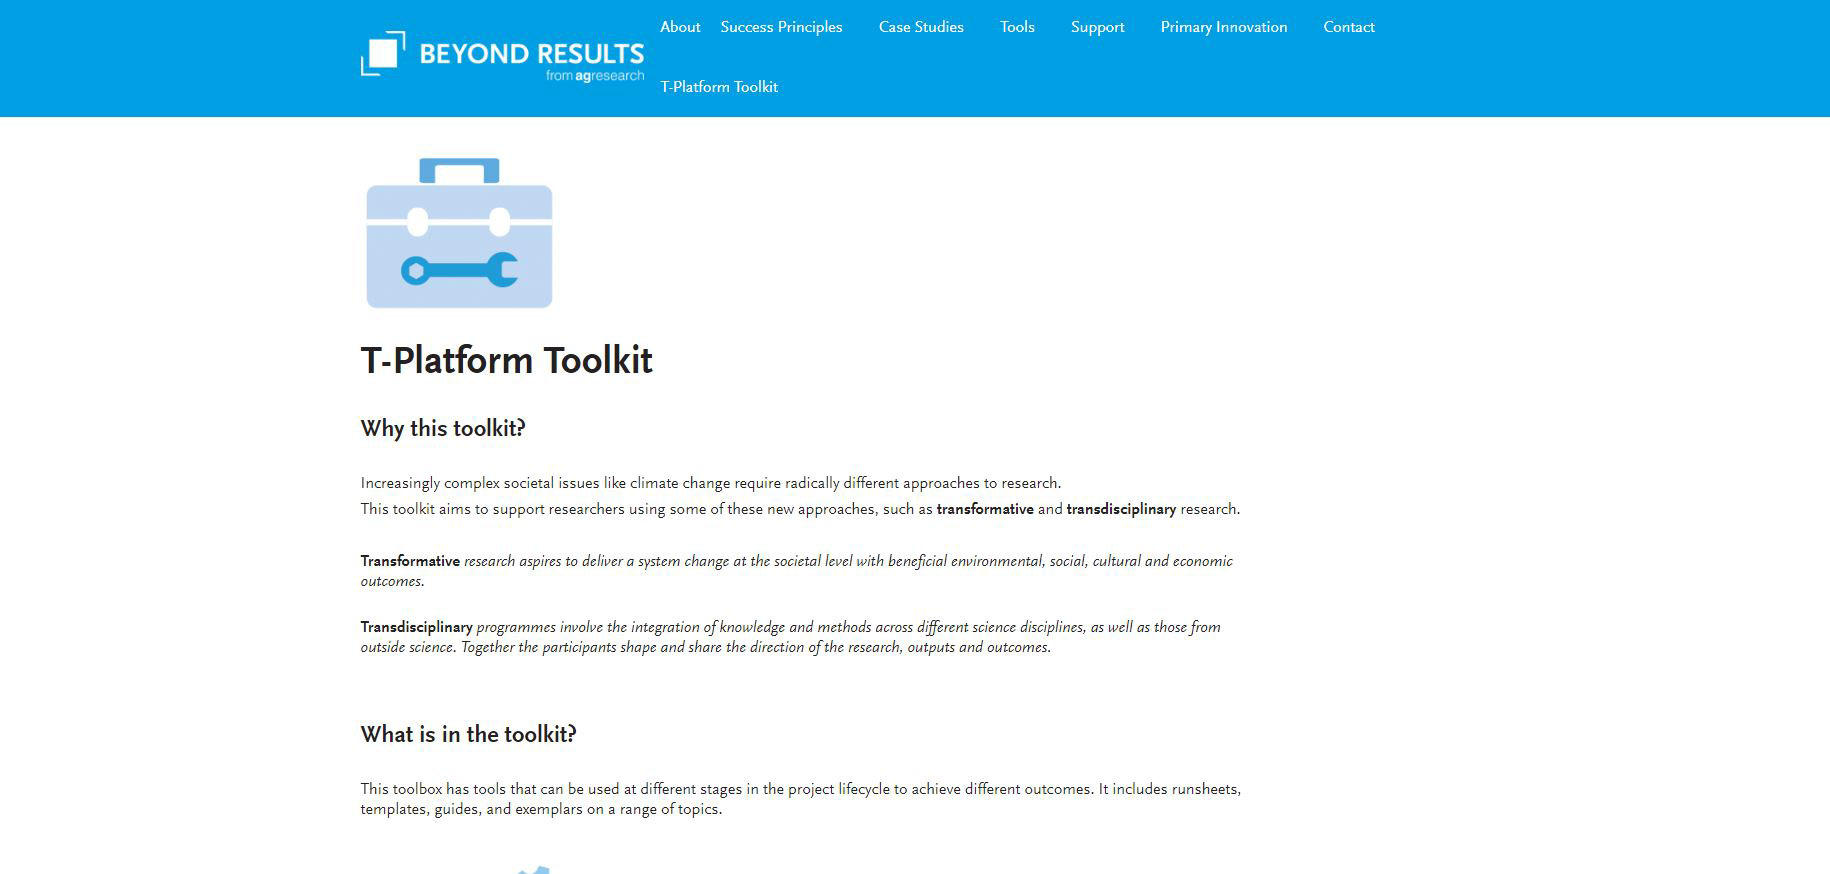
Transferring all the work onto Beyond Results
After building up a sufficient amount of resources, it was time to think about how users would be able to access and interact with them.
We ended up deciding to format it as multiple web pages instead of a PDF. That way it provided easy access to be edited in the future, and would also be far more userfriendly.
On the main page we included an explanation about the toolkit, and also included some quick links to tools we thought would be most relevant to most users.
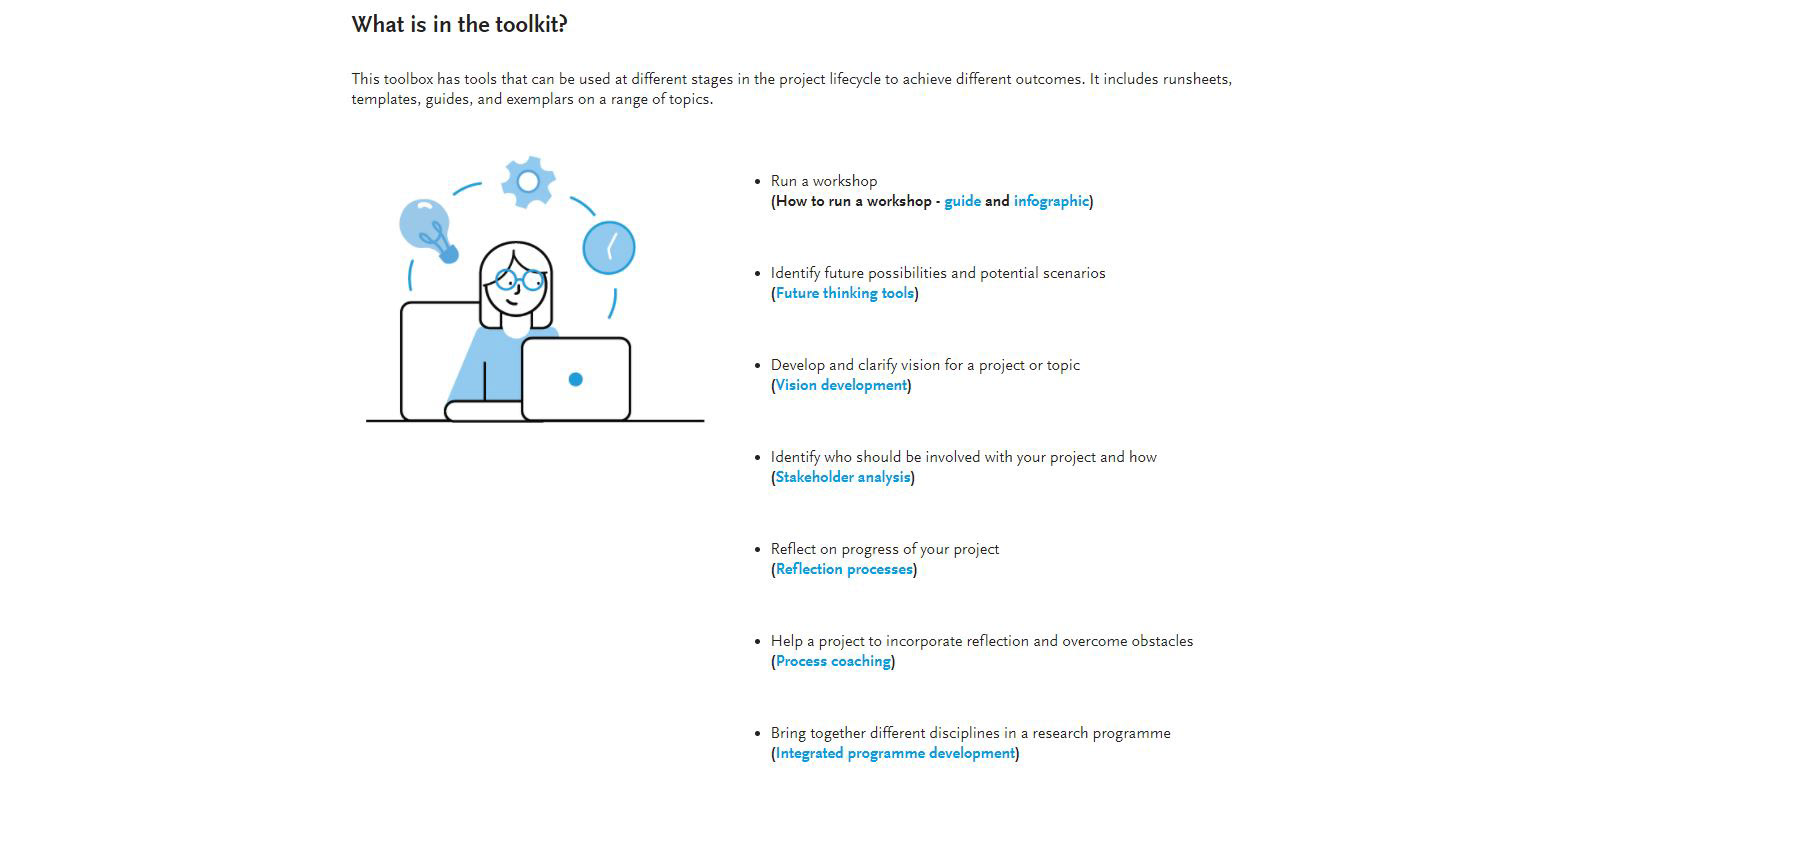
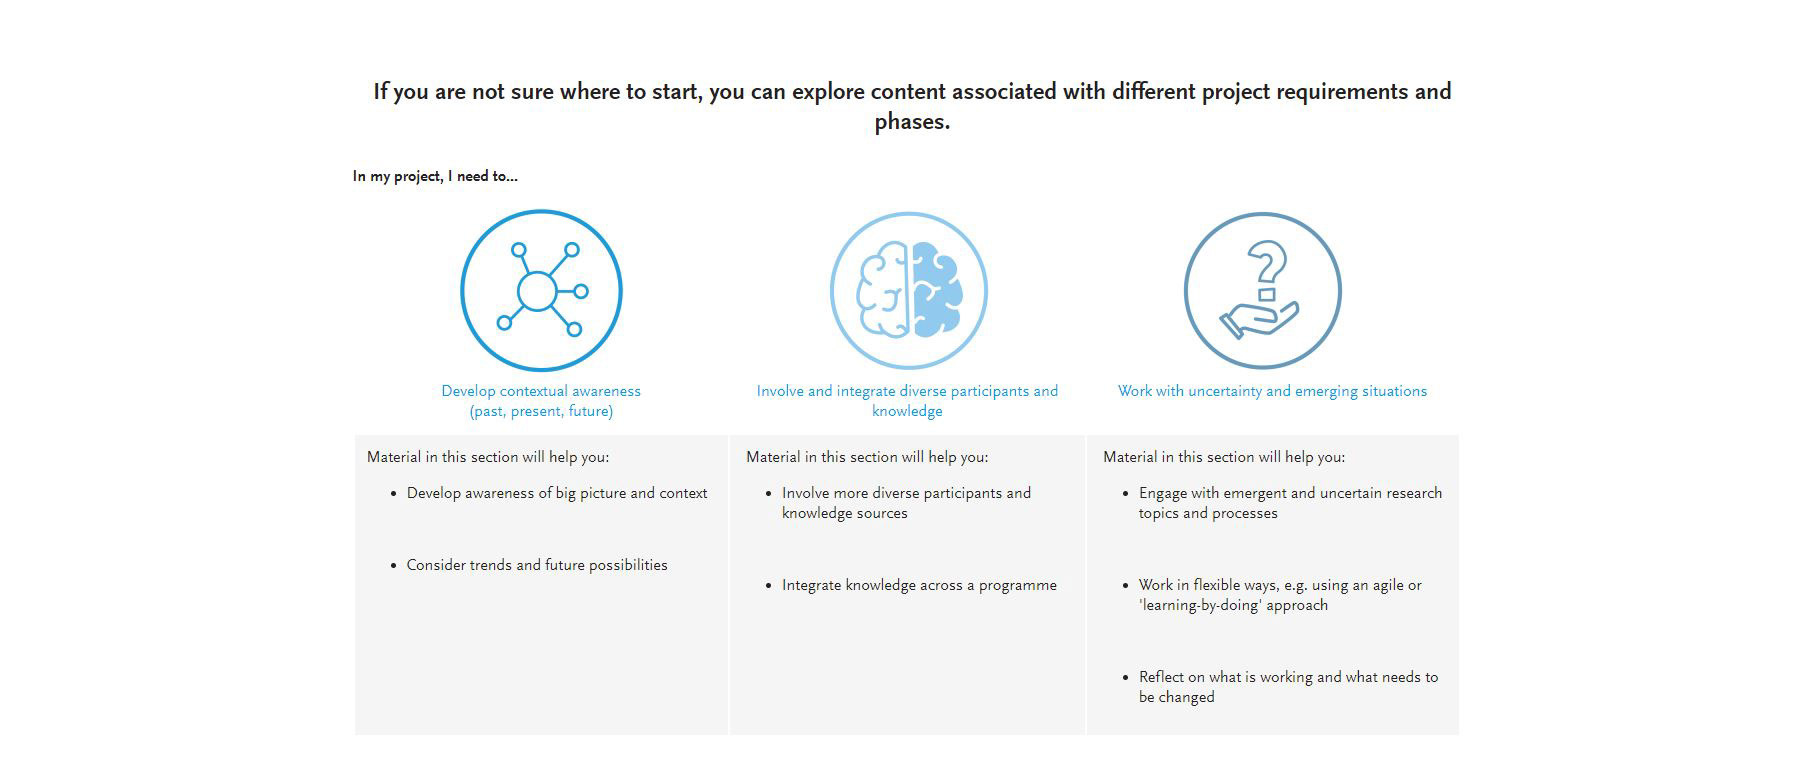
We did however have to think about how there were different people wanting different things for the toolkit. We had to think about the different people who would be using it, so we ended up creating 3 different ways that the resources could be navigated.
The first being navigation through project-related topics. This was made up of three different headings.
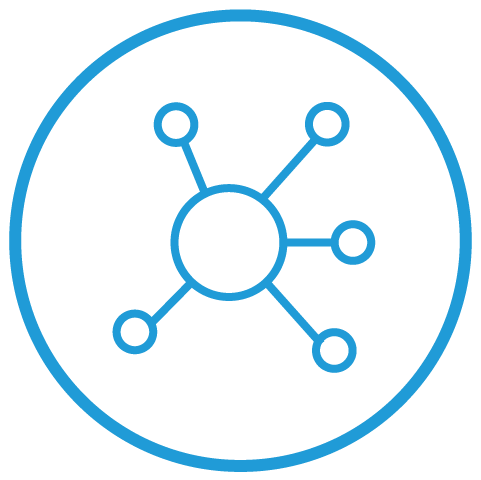
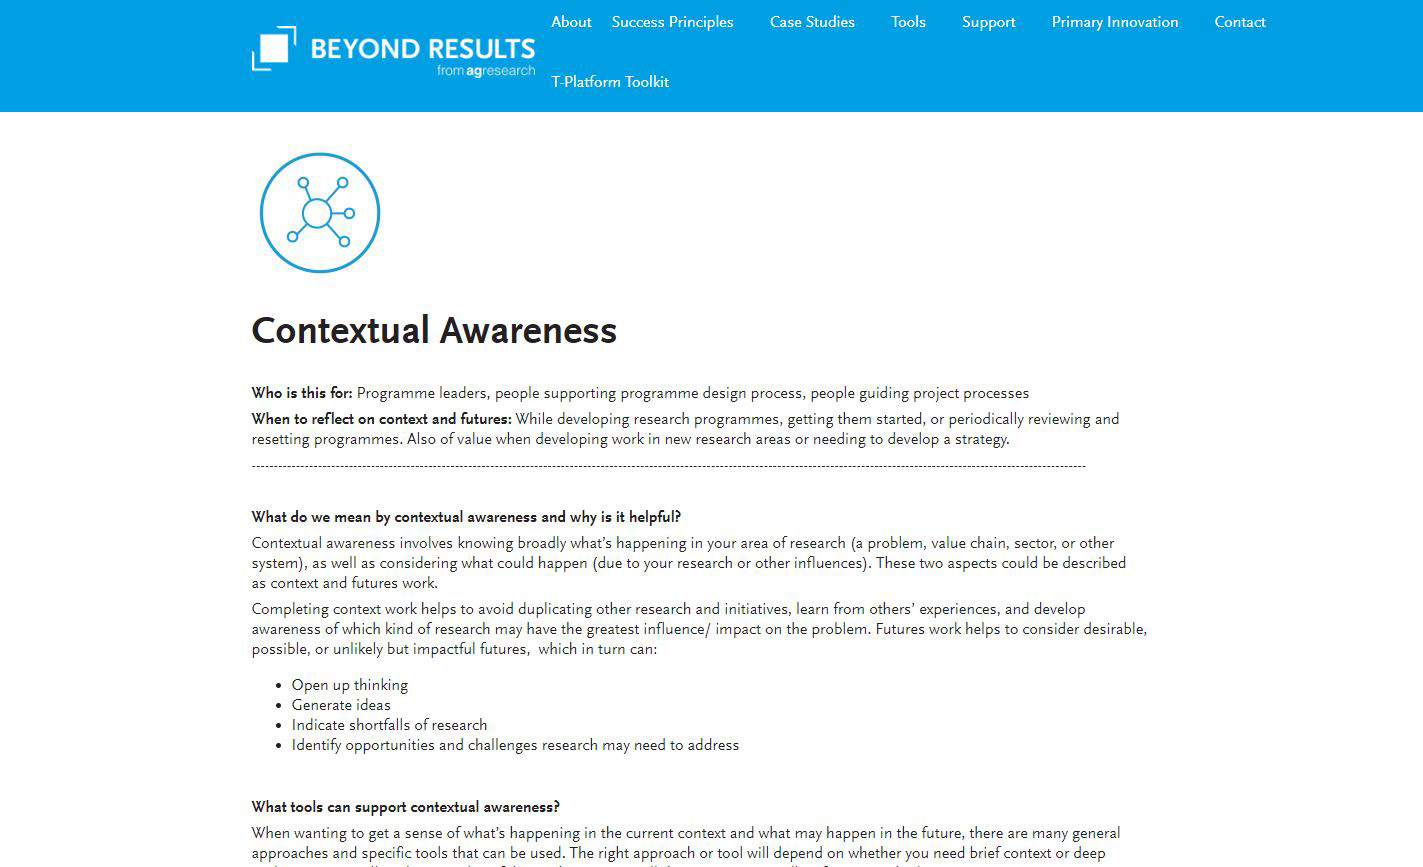
Contextual Awareness
Involving and Integrating Diverse Knowledge
Working With Uncertainty and Emerging Situations
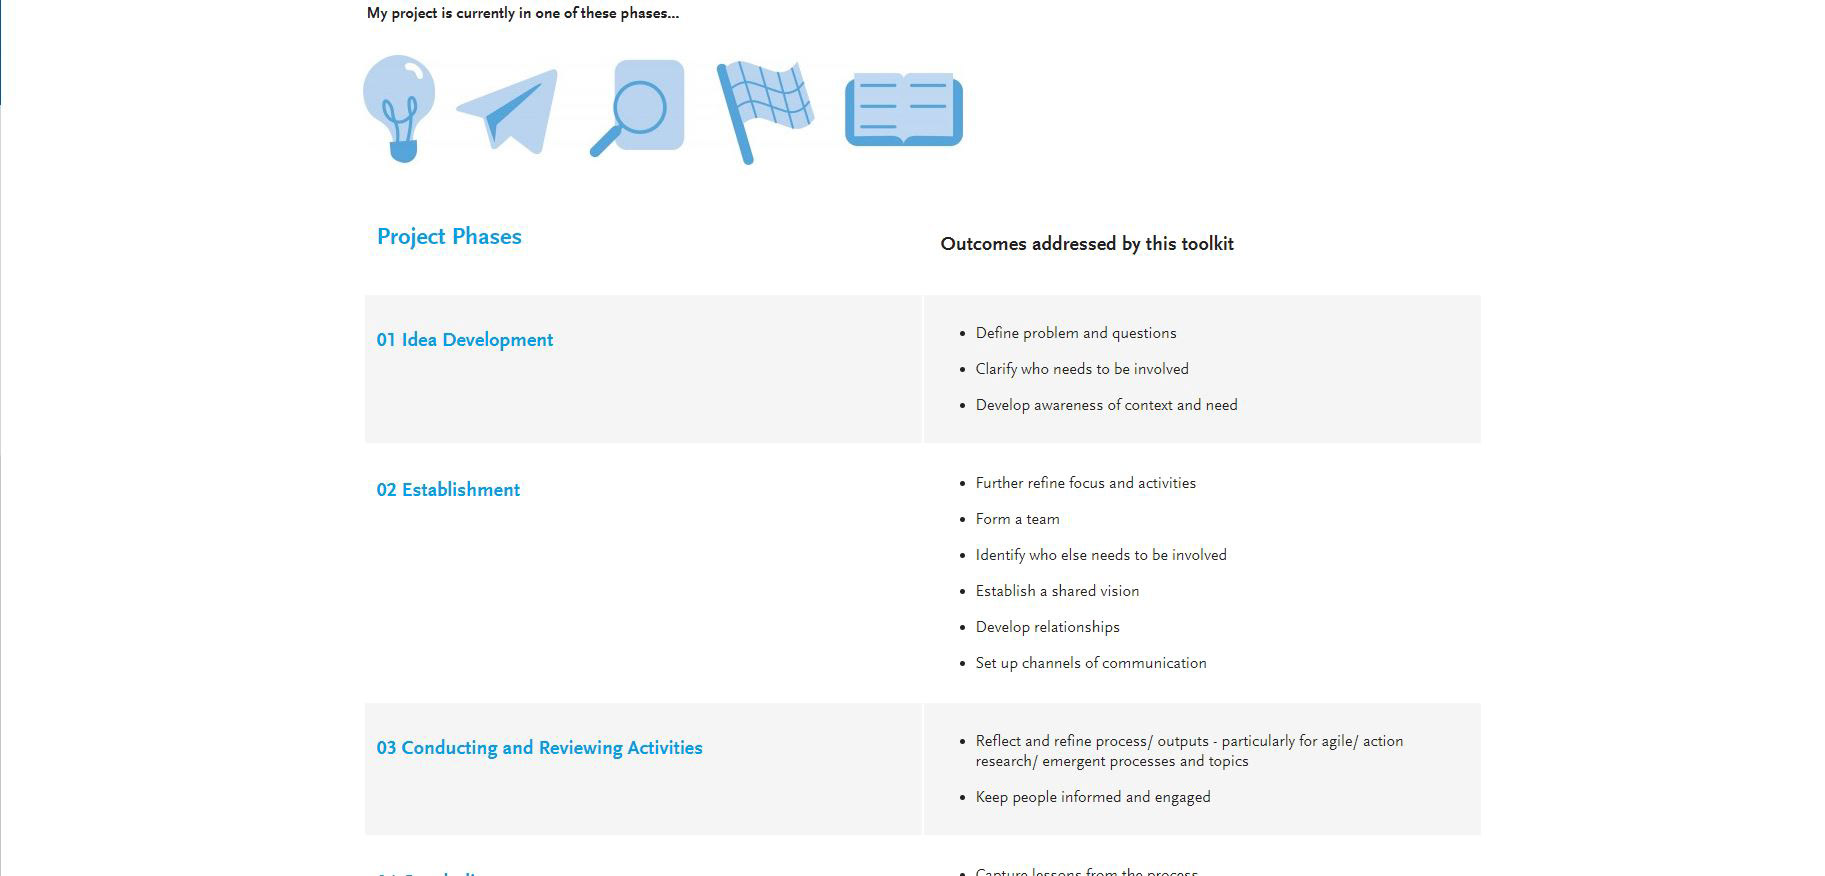
The second way that people could navigate the toolkit was through different Project Phases. This came about as many people felt there was support lacking at certain points throughout their project. We split the phases up into the following five headings.
01 Idea Development
02 Establishment
03 Conducting and Reviewing Activities
04 Concluding Project
05 Bringing Project Lessons to the Next Project Phase
The final way you could navigate the tools was by using the drop-down menu of the Toolkit tab and then selecting Index. This would take you to a page with links to all the different resources throughout the toolkit, that way if someone knew exactly what tool they were after they wouldn't have to go through all the different web pages.
Below is an example of a subpage of the main page. These sub-pages would provide more information on a certain topic, and would then have links to the relevant tools and guides related to the topic.
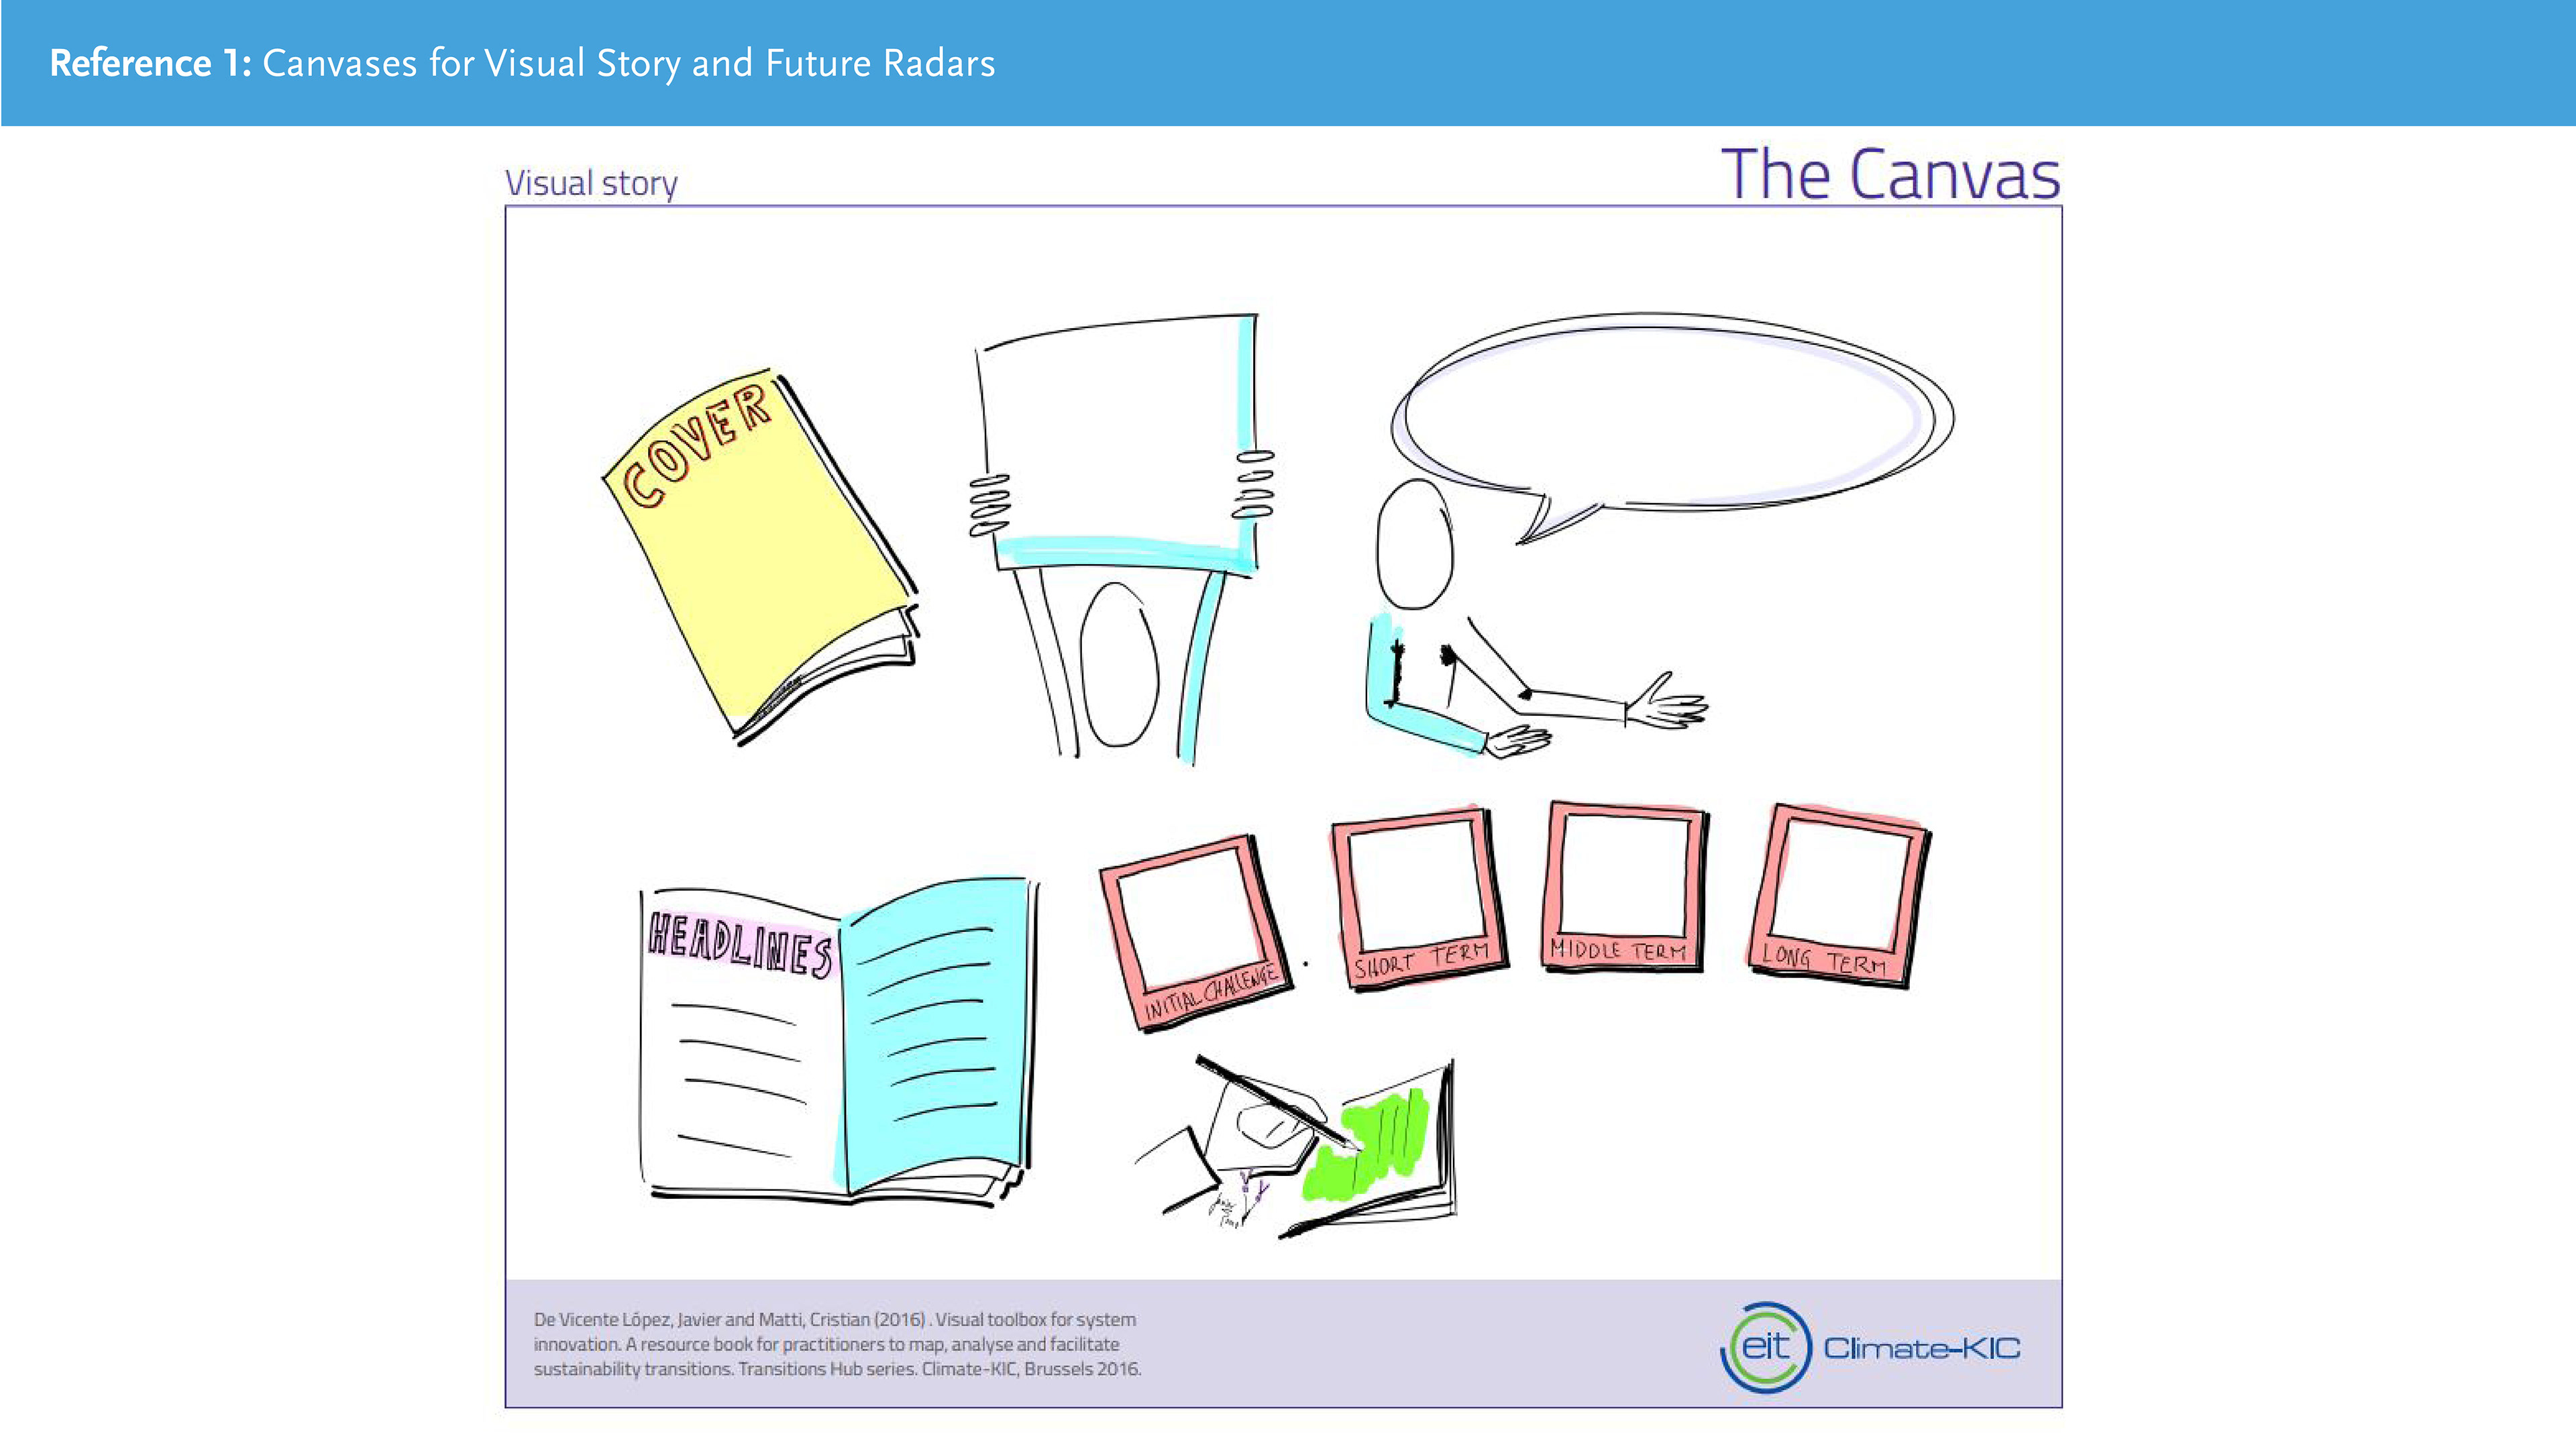
Some visual components created in Adobe Illustrator that were used throughout the internship